geophysics

research-roundup:-6-cool-science-stories-we-almost-missed

Research roundup: 6 cool science stories we almost missed


Also: the science of regular vs. gluten-free spaghetti, catching high-speed snake bites in action, etc.

Karnak Temple, Luxor, Egypt. Credit: Ben Pennington

It’s a regrettable reality that there is never enough time to cover all the interesting scientific stories we come across each month. In the past, we’ve featured year-end roundups of cool science stories we (almost) missed. This year, we’re experimenting with a monthly collection. October’s list includes the microstructural differences between regular and gluten-free spaghetti, capturing striking snakes in action, the mystery behind the formation of Martian gullies, and—for all you word game enthusiasts—an intriguing computational proof of the highest possible scoring Boggle board.

Highest-scoring Boggle board

boggle board showing highest scoring selection of letters

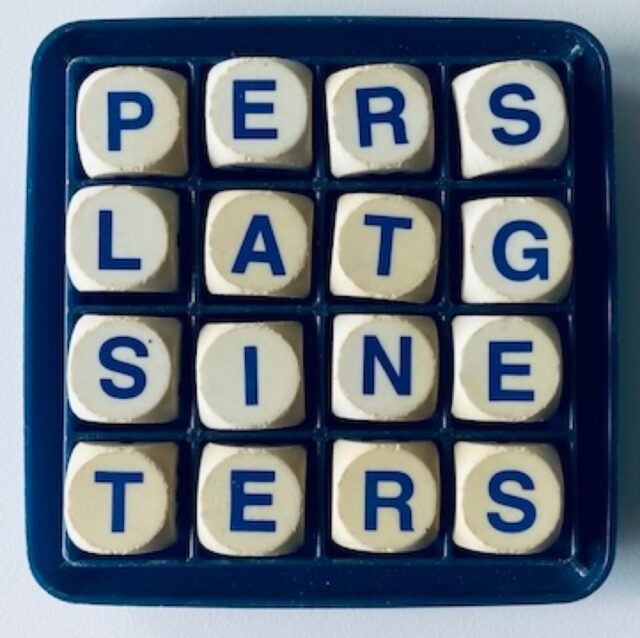
Credit: Dan Vanderkam

Sometimes we get handy story tips from readers about quirkily interesting research projects. Sometimes those projects involve classic games like Boggle, in which players find as many words as they can from a 4×4 grid of 16 lettered cubic dice, within a given time limit. Software engineer Dan Vanderkam alerted us to a a preprint he posted to the physics arXiv, detailing his quest to find the Boggle board configuration that yields the highest possible score. It’s pictured above, with a total score of 3,625 points, according to Vanderkam’s first-ever computational proof. There are more than 1000 possible words, with “replastering” being the longest.

Vanderkam has documented his quest and its resolution (including the code he used) extensively on his blog, admitting to the Financial Times that, “As far as I can tell, I’m the only person who is actually interested in this problem.” That’s not entirely true: there was an attempt in 1982 that found an optimal board yielding 2,195 points. Vanderkam’s board was known as possibly being the highest scoring, it was just very difficult to prove using standard heuristic search methods. Vanderkam’s solution involved grouping board configurations with similar patterns into classes, and then finding upper bounds to discard clear losers, rather than trying to tally scores for each board individually—i.e., an old school “branch and bound” technique.

DOI: arXiv, 2025. 10.48550/arXiv.2507.02117  (About DOIs).

Origins of Egypt’s Karnak Temple

Core samples being extracted at Karnak Temple

Credit: Ben Pennington

Egypt’s Karnak Temple complex, located about 500 meters of the Nile River near Luxor, has long been of interest to archaeologists and millions of annual tourists alike. But its actual age has been a matter of much debate. The most comprehensive geological survey conducted to date is yielding fresh insights into the temple’s origins and evolution over time, according to a paper published in the journal Antiquity.

The authors analyzed sediment cores and thousands of ceramic fragments from within and around the site to map out how the surrounding landscape has changed. They concluded that early on, circa 2520 BCE, the site would have experienced regular flooding from the Nile; thus, the earliest permanent settlement at Karnak would have emerged between 2591 and 2152 BCE, in keeping with the earliest dated ceramic fragments.  This would have been after river channels essentially created an island of higher ground that served as the foundation for constructing the temple. As those channels diverged over millennia, the available area for the temple expanded and thus, so did the complex.

This might be supported by Egyptian creation myths. “It’s tempting to suggest the Theban elites chose Karnak’s location for the dwelling place of a new form of the creator god, ‘Ra-Amun,’ as it fitted the cosmogonical scene of high ground emerging from surrounding water,” said co-author Ben Pennington, a geoarchaeologist at the University of Southampton. “Later texts of the Middle Kingdom (c.1980–1760 BC) develop this idea, with the ‘primeval mound’ rising from the ‘Waters of Chaos.’ During this period, the abating of the annual flood would have echoed this scene, with the mound on which Karnak was built appearing to ‘rise’ and grow from the receding floodwaters.”

DOI: Antiquity, 2025. 10.15184/aqy.2025.10185  (About DOIs).

Gullies on Mars

Mars dune with gullies in the Russell crater. On their way down, the ice blocks threw up levees.

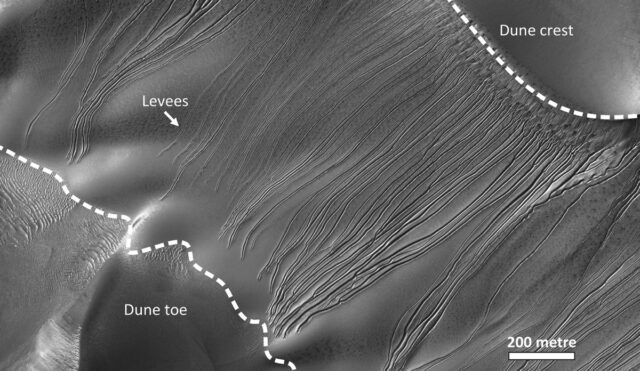
Credit: HiRISE/NASA/JPL/University of Arizon

Mars has many intriguing features but one of the more puzzling is the sinuous gullies that form on some its dunes. Scientists have proposed two hypotheses for how such gullies might form. The first is that they are the result of debris flow from an earlier time in the planet’s history where liquid water might have existed on the surface—evidence that the red planet might once have been habitable. The second is that the gullies form because of seasonal deposition and sublimation of CO2 ice on the surface in the present day. A paper published in the journal Geophysical Research Letters demonstrated strong evidence in favor of the latter hypothesis.

Building on her earlier research on how sublimation of CO2 ice can drive debris flows on Mars, earth scientist Lonneke Roelofs of Utrecht University in the Netherlands collaborated with scientists at the Open University in Milton Keynes, UK, which boasts a facility for simulating conditions on Mars. She ran several experiments with different sediment types, creating dune slopes of different angles and dropping blocks of CO2 ice from the top of the slope. At just the right angle, the blocks did indeed start digging into the sandy slope and moving downwards to create a gully. Roelofs likened the effect to a burrowing mole or the sandworms in Dune.

Per Roelofs, on Mars, CO2 ice forms over the surface during the winter and starts to sublimate in the spring. The ice blocks are remnants found on the shaded side of dune tops, where they break off once the temperature gets high enough and slide down the slope. At the bottom, they keep sublimating until all the CO2 has evaporated, leaving behind a hollow of sand.

DOI: Geophysical Research Letters, 2025. 10.1029/2024GL112860  (About DOIs).

Snake bites in action

S.G.C. Cleuren et al., 2025

Snakes can strike out and bite into prey in as little as 60 microseconds and until quite recently it just wasn’t technologically possible to capture those strikes in high definition. Researchers at Monash University in Australia decided to test 36 different species of snake in this way to learn more about their unique biting styles, detailing their results in a paper published in the Journal of Experimental Biology. And oh yes, there is awesome video footage.

Alistair Evans and Silke Cleuren traveled to Venomworld in Paris, France, where snake venom is harvested for medical and pharmaceutical applications.  For each snake species, they poked at said snake with a cylindrical piece of warm medical gel to mimic meaty muscle until the snake lunged and buried its fangs into the gel. Two cameras recorded the action at 1000 frames per second, capturing more than 100 individual strikes in great detail.

Among their findings: vipers moved the fastest when they struck, with the blunt-nosed viper accelerating up to 710 m/s2, landing a bite within 22 microseconds. All the vipers landed bites within 100 microseconds of striking. By contrast, the rough-scaled death adder only reached speeds of 2.5 m/s2. Vipers also sometimes pulled out and reinserted their fangs if they didn’t like the resulting angle; only then did they inject their venom. Elapids like the Cape coral cobra bit their prey repeatedly to inject their venom, while colubrids would tear gashes into their prey by sweeping their jaws from side to side, ensuing the maximum possible amount of venom was delivered.

DOI: Journal of Experimental Biology, 2025. 10.1242/jeb.250347  (About DOIs).

Spaghetti secrets

Spaghetti, like most pasta, is made of semolina flour, which is mixed with water to form a paste and then extruded to create a desired shape. The commercial products are then dried—an active area of research, since it’s easy for the strands to crack during the process. In fact, there have been a surprisingly large number of scientific papers seeking to understand the various properties of spaghetti, both cooking and eating it—the mechanics of slurping the pasta into one’s mouth, for instance, or spitting it out (aka, the “reverse spaghetti problem”); how to tell when it’s perfectly al dente; and how to get dry spaghetti strands to break neatly in two, rather than three or more scattered pieces.

Pasta also has a fairly low glycemic index, and is thus a good option for those with heart disease or type 2 diabetes. With the rise in the number of people with a gluten intolerance, gluten-free spaghetti has emerged as an alternative. The downside is that gluten-free pasta is harder to cook correctly and decidedly subpar in taste and texture (mouthfeel) compared to regular pasta. The reason for the latter lies in the microstructure, according to a paper published in the journal Food Hydrocolloids.

The authors used small-angle x-ray scattering and small-angle neutron scattering to analyze the microstructure of both regular and gluten-free pasta—i.e., the gluten matrix and its artificial counterpart—cooked al dente with varying salt concentrations in the water. They found that because of its gluten matrix, regular pasta has better resistance to structural degradation, and that adding just the right amount of salt further reinforces that matrix—so it’s not just a matter of salting to taste. This could lead to a better alternative matrix for gluten-free pasta that holds its structure better and has a taste and mouthfeel closer to that of regular pasta.

DOI: Food Hydrocolloids, 2025. 10.1016/j.foodhyd.2025.111855  (About DOIs).

Can machine learning identify ancient artists?

Dr Andrea Jalandoni studies finger flutings at a cave site in Australia

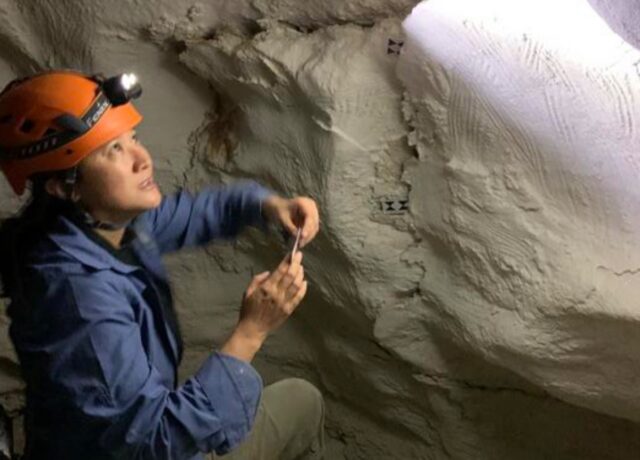
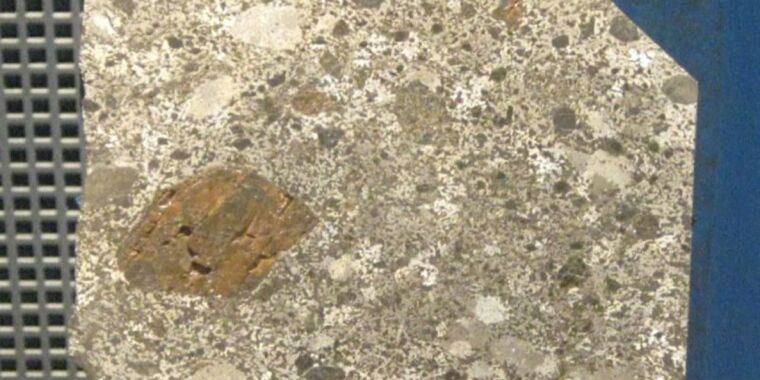
Credit: Andrea Jalandoni

Finger flutings are one of the oldest examples of prehistoric art, usually found carved into the walls of caves in southern Australia, New Guinea, and parts of Europe. They’re basically just marks made by human fingers drawn through the “moonmilk” (a soft mineral film) covering those walls. Very little is known about the people who left those flutings and while some have tried to draw inferences based on biometric finger ratios or hand size measurements—notably whether given marks were made by men or women—such methods produce inconsistent results and are prone to human error and bias.

That’s why digital archaeologist Andrea Jaladonia of Griffith University decided to experiment with machine learning image recognition methods as a possible tool, detailing her findings in a paper published the journal Scientific Reports. She recruited 96 adult volunteers to create their own finger flutings in two different settings: once in a virtual reality environment, and once on a substitute for the moonmilk clay that mimicked the look and feel of the real thing. Her team took images of those flutings and then used them to train two common image recognition models.

The results were decidedly mixed. The virtual reality images performed the worst, yielding highly unreliable attempts at classifying whether flutings were made by men or women. The images produced in actual clay produced better results, even reaching close to 84 percent accuracy in one model. But there were also signs the models were overfitting, i.e., memorizing patterns in the training data rather than more generalized patterns, so the approach needs more refinement before it is ready for actual deployment. As for why determining sex classifications matters, “This information has been used to decide who can access certain sites for cultural reasons,” Jalandoni explained.

DOI: Scientific Reports, 2025. 10.1038/s41598-025-18098-4  (About DOIs).

Photo of Jennifer Ouellette

Jennifer is a senior writer at Ars Technica with a particular focus on where science meets culture, covering everything from physics and related interdisciplinary topics to her favorite films and TV series. Jennifer lives in Baltimore with her spouse, physicist Sean M. Carroll, and their two cats, Ariel and Caliban.

Research roundup: 6 cool science stories we almost missed Read More »

one-less-thing-to-worry-about-in-2025:-yellowstone-probably-won’t-go-boom

One less thing to worry about in 2025: Yellowstone probably won’t go boom


There’s not enough melted material near the surface to trigger a massive eruption.

It’s difficult to comprehend what 1,000 cubic kilometers of rock would look like. It’s even more difficult to imagine it being violently flung into the air. Yet the Yellowstone volcanic system blasted more than twice that amount of rock into the sky about 2 million years ago, and it has generated a number of massive (if somewhat smaller) eruptions since, and there have been even larger eruptions deeper in the past.

All of which might be enough to keep someone nervously watching the seismometers scattered throughout the area. But a new study suggests that there’s nothing to worry about in the near future: There’s not enough molten material pooled in one place to trigger the sort of violent eruptions that have caused massive disruptions in the past. The study also suggests that the primary focus of activity may be shifting outside of the caldera formed by past eruptions.

Understanding Yellowstone

Yellowstone is fueled by what’s known as a hotspot, where molten material from the Earth’s mantle percolates up through the crust. The rock that comes up through the crust is typically basaltic (a definition based on the ratio of elements in its composition) and can erupt directly. This tends to produce relatively gentle eruptions where lava flows across a broad area, generally like you see in Hawaii and Iceland. But this hot material can also melt rock within the crust, producing a material called rhyolite. This is a much more viscous material that does not flow very readily and, instead, can cause explosive eruptions.

The risks at Yellowstone are rhyolitic eruptions. But it can be difficult to tell the two types of molten material apart, at least while they’re several kilometers below the surface. Various efforts have been made over the years to track the molten material below Yellowstone, but differences in resolution and focus have left many unanswered questions.

Part of the problem is that a lot of this data came from studies of seismic waves traveling through the region. Their travel is influenced by various factors, including the composition of the material they’re traveling through, its temperature, and whether it’s a liquid or solid. In a lot of cases, this leaves several potential solutions consistent with the seismic data—you can potentially see the same behavior from different materials at different temperatures.

To get around this issue, the new research measured the conductivity of the rock, which can change by as much as three orders of magnitude when transitioning from a solid to a molten phase. The overall conductivity we measure also increases as more of the molten material is connected into a single reservoir rather than being dispersed into individual pockets.

This sort of “magnetotelluric” data has been obtained in the past but at a relatively low resolution. For the new study, a dense array of sensors was placed in the Yellowstone caldera and many surrounding areas to the north and east. (You can compare the previous and new recording sites as black and red triangles on this map.)

Yellowstone’s plumbing

That has allowed the research team to build a three-dimensional map of the molten material underneath Yellowstone and to determine the fraction of the material in a given area that’s molten. The team finds that there are two major sources of molten material that extend up from the mantle-crust boundary at about 50 kilometers below the surface. These extend upward separately but merge about 20 kilometers below the surface.

Image of two large yellow lobes sitting below a smaller collection of reddish orange blobs of material. These are matched with features on the surface, including the present caldera and the sites of past eruptions.

Underneath Yellowstone: Two large lobs of hot material from the mantle (in yellow) melt rock closer to the surface (orange), creating pools of hot material (red and orange) that power hydrothermal systems and past eruptions, and may be the sites of future activity. Credit: Bennington, et al.

While they collectively contain a lot of molten basaltic material (between 4,000 and 6,500 cubic kilometers of it), it’s not very concentrated. Instead, this is mostly relatively small volumes of molten material traveling through cracks and faults in solid rock. This keeps the concentration of molten material below that needed to enable eruptions.

After the two streams of basaltic material merge, they form a reservoir that includes a significant amount of melted crustal material—meaning rhyolitic. The amount of rhyolitic material here is, at most, under 500 cubic kilometers, so it could fuel a major eruption, albeit a small one by historic Yellowstone standards. But again, the fraction of melted material in this volume of rock is relatively low and not considered likely to enable eruptions.

From there to the surface, there are several distinct features. Relative to the hotspot, the North American plate above is moving to the west, which has historically meant that the site of eruptions has moved from west to east across the continent. Accordingly, there is a pool off to the west of the bulk of near-surface molten material that no longer seems to be connected to the rest of the system. It’s small, at only about 100 cubic kilometers of material, and is too diffused to enable a large eruption.

Future risks?

There’s a similar near-surface blob of molten material that may not currently be connected to the rest of the molten material to the south of that. It’s even smaller, likely less than 50 cubic kilometers of material. But it sits just below a large blob of molten basalt, so it is likely to be receiving a fair amount of heat input. This site seems to have also fueled the most recent large eruption in the caldera. So, while it can’t fuel a large eruption today, it’s not possible to rule the site out for the future.

Two other near-surface areas containing molten material appear to power two of the major sites of hydrothermal activity, the Norris Geyser Basin and Hot Springs Basin. These are on the northern and eastern edges of the caldera, respectively. The one to the east contains a small amount of material that isn’t concentrated enough to trigger eruptions.

But the site to the northeast contains the largest volume of rhyolitic material, with up to nearly 500 cubic kilometers. It’s also one of only two regions with a direct connection to the molten material moving up through the crust. So, while it’s not currently poised to erupt, this appears to be the most likely area to trigger a major eruption in the future.

In summary, while there’s a lot of molten material near the current caldera, all of it is spread too diffusely within the solid rock to enable it to trigger a major eruption. Significant changes will need to take place before we see the site cover much of North America with ash again. Beyond that, the image is consistent with our big-picture view of the Yellowstone hotspot, which has left a trail of eruptions across western North America, driven by the movement of the North American plate.

That movement has now left one pool of molten material on the west of the caldera disconnected from any heat sources, which will likely allow it to cool. Meanwhile, the largest pool of near-surface molten rock is east of the caldera, which may ultimately drive a transition of explosive eruptions outside the present caldera.

Nature, 2025. DOI: 10.1038/s41586-024-08286-z  (About DOIs).

Photo of John Timmer

John is Ars Technica’s science editor. He has a Bachelor of Arts in Biochemistry from Columbia University, and a Ph.D. in Molecular and Cell Biology from the University of California, Berkeley. When physically separated from his keyboard, he tends to seek out a bicycle, or a scenic location for communing with his hiking boots.

One less thing to worry about in 2025: Yellowstone probably won’t go boom Read More »

astronomers-think-they’ve-figured-out-how-and-when-jupiter’s-red-spot-formed

Astronomers think they’ve figured out how and when Jupiter’s Red Spot formed

a long-lived vortex —

Astronomers concluded it is not the same and that Cassini’s spot disappeared in 1708.

Enhanced image of Jupiter’s Great Red Spot, as seen from a Juno flyby in 2018. The Red Spot we see today is likely not the same one famously observed by Cassini in the 1600s.

Enlarge / Enhanced Juno image of Jupiter’s Great Red Spot in 2018. It is likely not the same one observed by Cassini in the 1600s.

The planet Jupiter is particularly known for its so-called Great Red Spot, a swirling vortex in the gas giant’s atmosphere that has been around since at least 1831. But how it formed and how old it is remain matters of debate. Astronomers in the 1600s, including Giovanni Cassini, also reported a similar spot in their observations of Jupiter that they dubbed the “Permanent Spot.” This prompted scientists to question whether the spot Cassini observed is the same one we see today. We now have an answer to that question: The spots are not the same, according to a new paper published in the journal Geophysical Research Letters.

“From the measurements of sizes and movements, we deduced that it is highly unlikely that the current Great Red Spot was the ‘Permanent Spot’ observed by Cassini,” said co-author Agustín Sánchez-Lavega of the University of the Basque Country in Bilbao, Spain. “The ‘Permanent Spot’ probably disappeared sometime between the mid-18th and 19th centuries, in which case we can now say that the longevity of the Red Spot exceeds 190 years.”

The planet Jupiter was known to Babylonian astronomers in the 7th and 8th centuries BCE, as well as to ancient Chinese astronomers; the latter’s observations would eventually give birth to the Chinese zodiac in the 4th century BCE, with its 12-year cycle based on the gas giant’s orbit around the Sun. In 1610, aided by the emergence of telescopes, Galileo Galilei famously observed Jupiter’s four largest moons, thereby bolstering the Copernican heliocentric model of the solar system.

(a) 1711 painting of Jupiter by Donato Creti showing the reddish Permanent Spot. (b) November 2, 1880, drawing of Jupiter by E.L. Trouvelot. (c) November 28, 1881, drawing by T.G. Elger.

Enlarge / (a) 1711 painting of Jupiter by Donato Creti showing the reddish Permanent Spot. (b) November 2, 1880, drawing of Jupiter by E.L. Trouvelot. (c) November 28, 1881, drawing by T.G. Elger.

Public domain

It’s possible that Robert Hooke may have observed the “Permanent Spot” as early as 1664, with Cassini following suit a year later and multiple more sightings through 1708. Then it disappeared from the astronomical record. A pharmacist named Heinrich Schwabe made the earliest known drawing of the Red Spot in 1831, and by 1878 it was once again quite prominent in observations of Jupiter, fading again in 1883 and at the onset of the 20th century.

Perhaps the spot is not the same…

But was this the same Permanent Spot that Cassini had observed? Sánchez-Lavega and his co-authors set out to answer this question, combing through historical sources—including Cassini’s notes and drawings from the 17th century—and more recent astronomical observations and quantifying the results. They conducted a year-by-year measurement of the sizes, ellipticity, area, and motions of both the Permanent Spot and the Great Red Spot from the earliest recorded observations into the 21st century.

The team also performed multiple numerical computer simulations testing different models for vortex behavior in Jupiter’s atmosphere that are the likely cause of the Great Red Spot. It’s essentially a massive, persistent anticyclonic storm. In one of the models the authors tested, the spot forms in the wake of a massive superstorm. Alternatively, several smaller vortices created by wind shear may have merged, or there could have been an instability in the planet’s wind currents that resulted in an elongated atmospheric cell shaped like the spot.

Sánchez-Lavega et al. concluded that the current Red Spot is probably not the same as that observed by Cassini and others in the 17th century. They argue that the Permanent Spot had faded by the start of the 18th century, and a new spot formed in the 19th century—the one we observe today, making it more than 190 years old.

Comparison between the Permanent Spot and the current Great Red Spot. (a) December 1690. (b) January 1691. (c) January 19, 1672. (d) August 10, 2023.

Enlarge / Comparison between the Permanent Spot and the current Great Red Spot. (a) December 1690. (b) January 1691. (c) January 19, 1672. (d) August 10, 2023.

Public domain/Eric Sussenbach

But maybe it is?

Others remain unconvinced of that conclusion, such as astronomer Scott Bolton of the Southwest Research Institute in Texas. “What I think we may be seeing is not so much that the storm went away and then a new one came in almost the same place,” he told New Scientist. “It would be a very big coincidence to have it occur at the same exact latitude, or even a similar latitude. It could be that what we’re really watching is the evolution of the storm.”

The numerical simulations ruled out the merging vortices model for the spot’s formation; it is much more likely that it’s due to wind currents producing an elongated atmospheric shell. Furthermore, in 1879, the Red Spot measured about 24,200 miles (39,000 kilometers) at its longest axis and is now about 8,700 miles (14,000 kilometers). So, the spot has been shrinking over the ensuing decades and becoming more rounded. The Juno mission’s most recent observations also revealed the spot is thin and shallow.

The question of why the Great Red Spot is shrinking remains a matter of debate. The team plans further simulations aiming to reproduce the shrinking dynamics and predict whether the spot will stabilize at a certain size and remain stable or eventually disappear like Cassini’s Permanent Spot presumably did.

Geophysical Research Letters, 2024. DOI: 10.1029/2024GL108993  (About DOIs).

Astronomers think they’ve figured out how and when Jupiter’s Red Spot formed Read More »

a-giant-meteorite-has-been-lost-in-the-desert-since-1916—here’s-how-we-might-find-it

A giant meteorite has been lost in the desert since 1916—here’s how we might find it

“This story has everything…” —

A tale of “sand dunes, a guy named Gaston, secret aeromagnetic surveys, and camel drivers.”

Chinguetti slice at the National Museum of Natural History

Enlarge / Chinguetti slice at the National Museum of Natural History. A larger meteorite reported in 1916 hasn’t been spotted since.

In 1916, a French consular official reported finding a giant “iron hill” deep in the Sahara desert, roughly 45 kilometers (28 miles) from Chinguetti, Mauritania—purportedly a meteorite (technically a mesosiderite) some 40 meters (130 feet) tall and 100 meters (330 feet) long. He brought back a small fragment, but the meteorite hasn’t been found again since, despite the efforts of multiple expeditions, calling its very existence into question.

Three British researchers have conducted their own analysis and proposed a means of determining once and for all whether the Chinguetti meteorite really exists, detailing their findings in a new preprint posted to the physics arXiv. They contend that they have narrowed down the likely locations where the meteorite might be buried under high sand dunes and are currently awaiting access to data from a magnetometer survey of the region in hopes of either finding the mysterious missing meteorite or confirming that it likely never existed.

Captain Gaston Ripert was in charge of the Chinguetti camel corps. One day he overheard a conversation among the chameliers (camel drivers) about an unusual iron hill in the desert. He convinced a local chief to guide him there one night, taking Ripert on a 10-hour camel ride along a “disorienting” route, making a few detours along the way. He may even have been literally blindfolded, depending on how one interprets the French phrase en aveugle, which can mean either “blind” (i.e. without a compass) or “blindfolded.” The 4-kilogram fragment Ripert collected was later analyzed by noted geologist Alfred Lacroix, who considered it a significant discovery. But when others failed to locate the larger Chinguetti meteorite, people started to doubt Ripert’s story.

“I know that the general opinion is that the stone does not exist; that to some, I am purely and simply an imposter who picked up a metallic specimen,” Ripert wrote to French naturalist Theodore Monod in 1934. “That to others, I am a simpleton who mistook a sandstone outcrop for an enormous meteorite. I shall do nothing to disabuse them, I know only what I saw.”

Encouraged by a separate report of local blacksmiths claiming to recover iron from a giant block somewhere east or southeast of Chinguetti, Monod intermittently searched for the meteorite several times over the ensuing decades, to no avail. A pilot named Jacques Gallouédec thought he spotted a dark silhouette in the Saharan dunes in the 1980s. But neither Monod nor a second expedition in the late 1990s—documented by the UK’s Channel 4—could find anything. Monod concluded in 1989 that Ripert had likely mistakenly identified a sedimentary rock “with no trace of metal” as a meteorite.

Still, as Rutgers University physicist Matt Buckley noted on Bluesky, “This story has everything: giant unexplained meteorites, sand dunes, a guy named Gaston, ductile nickel needles, secret aeromagnetic surveys, and camel drivers.” So naturally, it intrigued Stephen Warren of Imperial College London, Oxford University’s Ekaterini Protopapa, and Robert Warren, who began their own search for the mysterious missing meteorite in 2020.

A giant meteorite has been lost in the desert since 1916—here’s how we might find it Read More »