The $140K Question: Cost Changes Over Time
In The $140,000 Question, I went over recent viral claims about poverty in America.
The calculations behind the claims were invalid, the central claim (that the ‘true poverty line’ was $140k) was absurd, but the terrible vibes are real. People increasingly feel that financial life is getting harder and that success is out of reach.
‘Real income’ is rising, but costs are rising even more.
Before we get to my central explanations for that – the Revolution of Rising Expectations and the Revolution of Rising Requirements – there are calculations and histories to explore, which is what this second post is about.
How are costs changing in America, both in absolute terms and compared to real incomes, for key items: Consumer goods, education, health care and housing?
That’s a huge percentage of where we spend our post-tax money.
And how is household wealth actually changing?
The economists are right that the basket of goods and services we typically purchase in these areas has greatly increased in both quantity and quality, in spite of various severe supply side problems mostly caused by regulations.
That is not what determines whether a person or family can pay their bills.
People keep saying and feeling that the cost of living is going up and things are getting harder. Economists keep saying no, look at the data, you are buying better goods, so you are wrong.
Both things can be true at once. It also means people talk past each other a lot.
There was an iteration on this back in May, when Curtis Yarvin declared a disingenuous ‘beef’ with Scott Alexander on such questions. A good example of the resulting rhetoric was this exchange between Scott Alexander and Mike Solana.
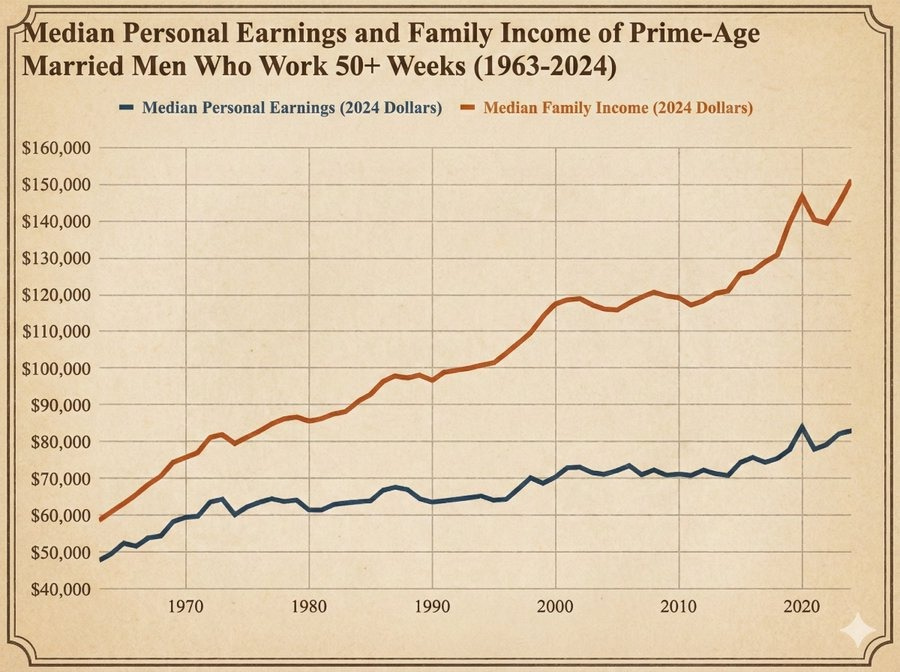
Mike Solana: guy will say “things are harder now than they were, harder than they have ever been, I don’t know how to make my life work in this new american economy” and an intellectual will show him a graph that indicates “median wages have increased 30% since the turn of the century.”
Guy will say the cost of a house has more than doubled. He’ll say he can’t afford his home town anymore. The intellectual will make a macro argument with another chart. it will seem smart.
Guy will still be miserable, his life will still be hard. And he will vote.
As with the $140,000 question, many of the specific cost claims of the various Guys here will be wrong, but their life will be hard, and they will be unhappy. And vote.
Evaluating and often refuting specific claims is a necessary background step. So that’s what this post is here to do. On its own, it’s a distraction, but you need to do it first.
Two years ago I covered the debate around Cass’s Cost of Thriving Index, and the debate over whether the true ‘cost of thriving’ was going up or down.
The Cost of Thriving Index is an attempt to assemble the basket of goods required for ‘thriving’ in each era and then compare combined costs as a function of what a single man can hope to earn, without regard to the rising quality of the basket over time.
The post covered the technical arguments in each area between Winship and Cass. Cass argued that thriving had gotten a lot harder. Winship argued against this.
My conclusion was:
-
Cass’s calculations were importantly flawed. My ‘improved COTI’ shows a basic basket was ~13% harder for a typical person to afford in 2023 than it was in 1985.
-
Critics of the index, especially Winship, misunderstood the point of the exercise and in many places trying to solve the wrong problem using the wrong methods based on a wrong model of the world derived from poor thinking. Unfortunately all their mistakes failed to cancel out.
-
You had to consume goods that cost ~75% more ‘real income’ in order to thrive in 2023 than you did in 1985. ‘Real income’ went up 53%. Are you better off in 2023 or in 1985? It is not obvious. One effect does not negate the other.
This calculation left out at least one very important similar consideration in particular that neither side considered: The time and money costs of not letting kids be kids, and the resulting need to watch them like a hawk at all times, requiring vastly more childcare. You can buy that, or you can pay with your time. Either way, you pay up.
The two sides continue to talk past each other. Before we can do a synthesis, we need to cover the actual cost details.
I don’t quite fully buy the Housing Theory of Everything.
But is close.
House prices have risen quite a lot, as have interest rates. So did incomes.
If you’re okay living where people don’t typically want to live, then things aren’t bad.
However, people are less accepting of that, which is part of the Revolution of Rising Expectations, and opportunity has concentrated in the expensive locations.
Noah Smith: In terms of wages, income, and wealth, Gen Z and Millennials are doing much better than previous generations. Corporate America is not failing the youth.
It’s only housing that’s really broken.
Charles Fain Lehman: Americans are unhappy because housing is illegal.
Zac Hill:
illegal aliens -> illegal housing.
I would instead say, if housing was legal, there would be a lot less unhappiness.
More precisely: If building housing was generally legal, including things like SROs and also massively more capacity in general in the places people want to live, then housing costs would be a lot lower, people would have vastly more Slack, and the whole thing would seem far more solvable.
If you look at median home prices, things actually look like they’ve always been pretty terrible, as in this is a share of 200% of median income:
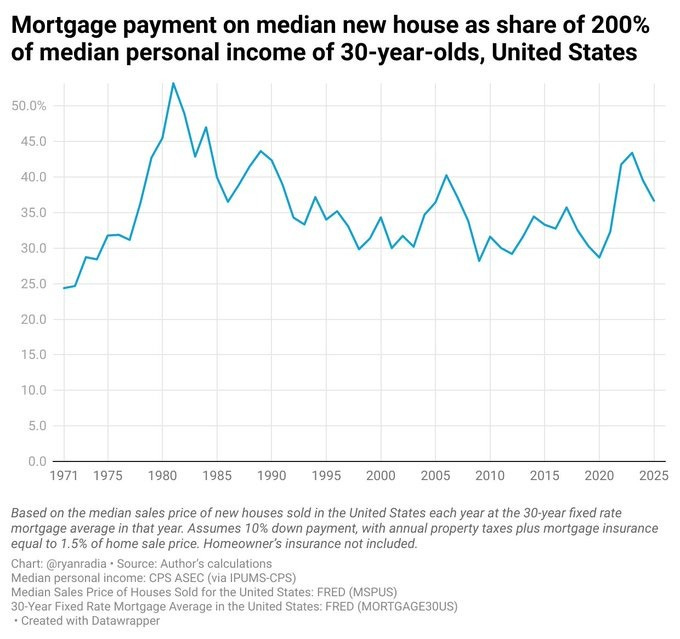
The median household, with a median income and no outside help, does not by default buy the median house at today’s interest rate. Houses are largely bought with wealth, or owned or acquired in other ways, so by default if you’re relying purely on a median income you’re getting a lot less than the median house. Which is totally fine, the median house is historically huge, you can notch down a bit. Also, when rates go down we refinance and when they go up we delay moving, which lowers costs.
But if we suppose you’re a median income earner trying to buy the median house today. If you believe the above graph, it’s going to cost you 70% of your income to make a mortgage payment, plus you’ll need a down payment, so yeah, that’s not going to happen. But that number hasn’t been under 50% in fifty years, so people have long had to find another way and make compromises.
The graph does seem like it has to be understating the jump in recent years, with the jump in mortgage rates, and here’s the Burns Affordability Index, which divides the median monthly housing cost (all-in including insurance) for a 10% down, 30-year-fixed mortgage at current rates versus 125% of the median income (seriously, guys, 100%, use 100% and we can adjust for dual incomes):
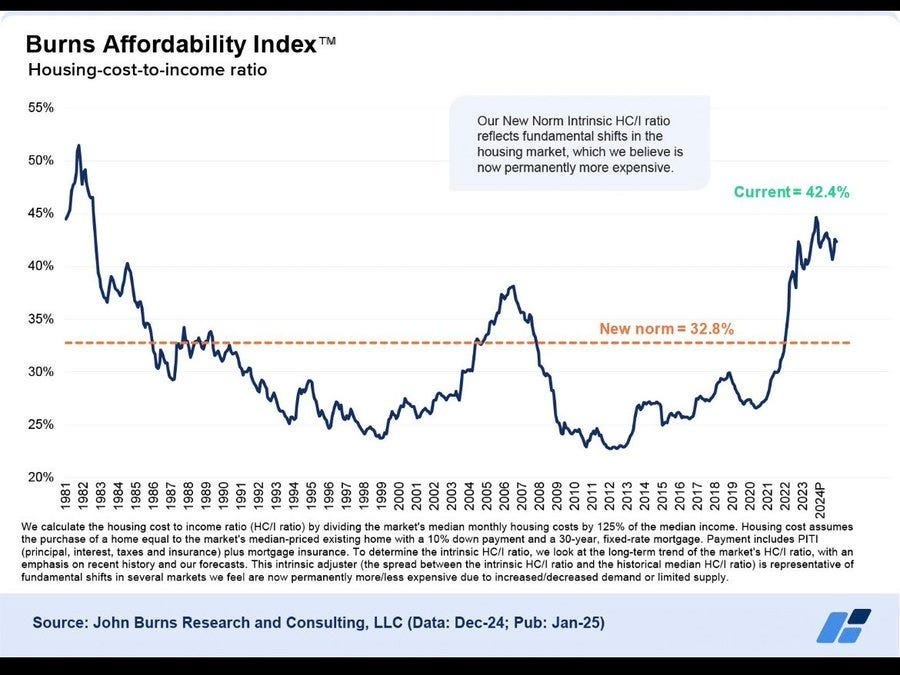
I’m willing to believe that this jump happened, and that some of it is permanent, because interest rates were at historic lows for a long time and we’re probably not going to see that again for a while even if AI fizzles.
That 42% buys a lot more house than the 33% did in 1986. Compared to the early 1970s (so when interest rates hadn’t shot up yet) Gale Pooley says a given percentage of household income (counting the shift to two incomes, mind) gets you 73% more house, average size went from 1,634 square feet to 2,614, per person it went from 534 to 1,041, many amenities are much more common (AC, Garage, 4+ bedrooms, etc) and actual housing costs haven’t risen much as a percentage of income.
That doesn’t make the new house you need any easier to pay for. More people are working and paying a higher percentage of income in order to pay for that house, again especially in the places with futures (which also are the sources of media).
Things will look worse if you look at the major cities, where there is the most opportunity, and where people actually want to live. This is NIMBY, it is quite bad, and we need to fix it.
That includes increasing unwillingness to live far away from work, and endure what is frankly a rather terrible commute, Tristan’s here is relatively light.
Tristan Cunha: When I got out of college 20 years ago I applied to jobs online, found an apartment online, got a car loan online, etc. So I remember searching and comparing the price of everything.
When people complain about how tough things are now I search and can find the rent for an apartment in the building I lived in, or every level jobs at the first company I worked at, etc. and it doesn’t seem that expensive to me. Sure the nominal prices have gone up, but the rent as a percentage of every level salary is about the same.
I think the big difference is when I tell young adults now that I had a 30-60 minute commute in to the city on the train, and had a roommate in a tiny apartment in the suburbs, they think that’s a huge sacrifice.
For a while a lot of the story of things getting harder was that healthcare and education costs were rising rapidly, far faster than incomes.
Did we turn this around? Noah Smith strongly asserted during the last iteration of the argument that this is solved, the same way the data says that real wages are now accelerating.
He starts off with the famous Mark Perry price changes chart.
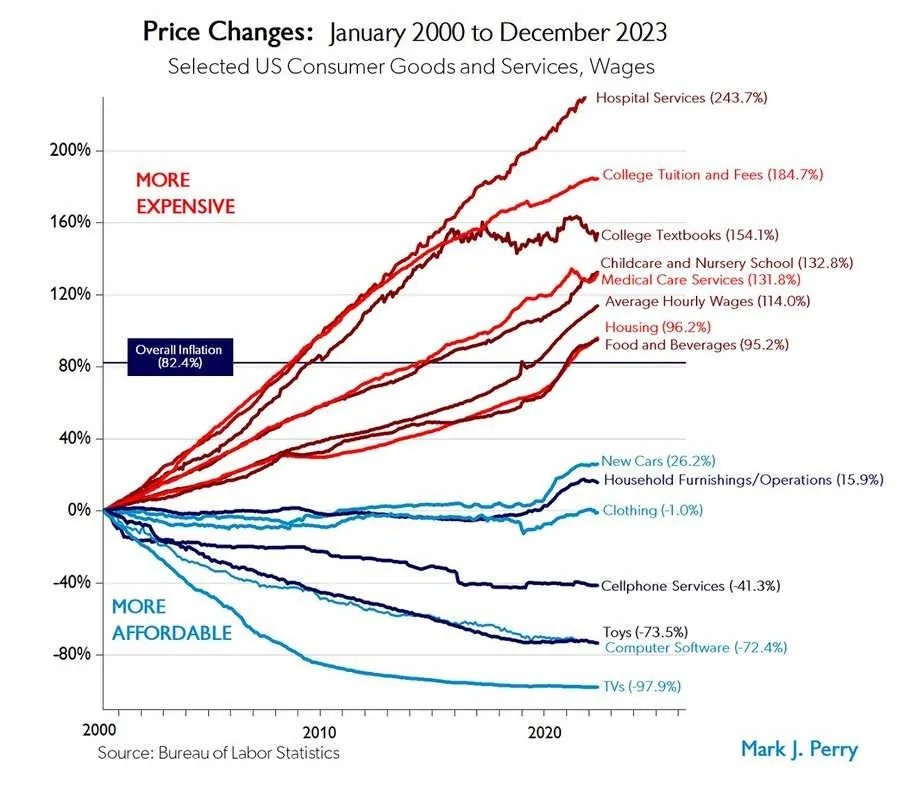
Noah Smith: And the story was compelling because it came with a simple theory to explain it. This was the notion that manufacturing productivity naturally increases faster than service productivity. Conceptually, it seems easier to figure out how to rearrange production processes in a factory, and apply new machine tools, than to figure out new ways to educate kids or take care of Grandma.
The story of healthcare and education goes beyond not getting the discounts on manufactured goods. It extends to a large rise in the amount of goods and services we had to purchase, much of it wasted – Hansonian medicine, academic administrative offices and luxury facilities, credential inflation and years spent mostly on signaling, and so on. Don’t try to pass this all off as Baumol’s Cost Disease.
Noah Smith: If service costs rise relentlessly while manufacturing costs fall, it portends a grim future — one where we have cheap gadgets, but where the big necessities of modern middle-class life are increasingly out of reach. And in fact, that was the story a lot of people were telling in the mid-2010s.
That story led to a certain techno-pessimism. If technology could give us cheap gadgets, but couldn’t make the basics of modern life any cheaper, what good was it?
Step back to first principles. This can’t happen purely ‘because cost disease’ unless the total labor demanded is rising.
-
You provide one person-unit of labor.
-
You buy [X]-units of labor to get [S] services and also buy [Y]-units of goods.
-
That only gets harder for you if either:
-
The required quality or quantity of [X] or [Y] is rising.
-
The cost of a unit of goods is rising relative to incomes.
-
The labor you need is rising in cost faster than your own labor.
-
Which is it?
I assert that the primary problem is that [X] is rising, without much benefit to you.
The secondary issue is a fixed supply of healthcare-relevant [X]s via occupational licensing. Relative to required services, labor productivity and supply are falling.
The failure of educational technologies like online education only seemed to drive the point home — it seemed like we’d always just be stuck with a teacher giving lectures on a board to 20 or 30 kids.
The ‘failure of online education’ so far has been due to trying to duplicate that 20-30 kid classroom over zoom. That was always going to be a dystopian nightmare and wouldn’t save on labor anyway.
Why is a class of the same size so much more expensive in units of middle class labor? Noah focuses on higher education later in the post, but as an obvious lower education example: The New York City DOE school system costs $39k per student. You think that mostly pays for the teachers?
If all we do is hold the basket of required services [S] constant, we should require less labor units [X] to meet our needs as productivity improves, at least due to technology. Instead, we need more labor.
Noah then covers attempts to solve the cost issues via policy, or at least to stop making the problem worse via policies that restrict supply and subsidize (and I would add mandate) demand, and instead move around taxes and subsidies in smarter ways. The solutions he seems to favor here still mainly continue to look a lot like subsidizing demand and using transfers.
But, behold, says Noah. Health care costs have stopped increasing as a percentage of GDP. So Everything Is Fine now, or at least not getting worse. The ways in which he argues things are doing fine helped me realize why things are indeed not so fine here.
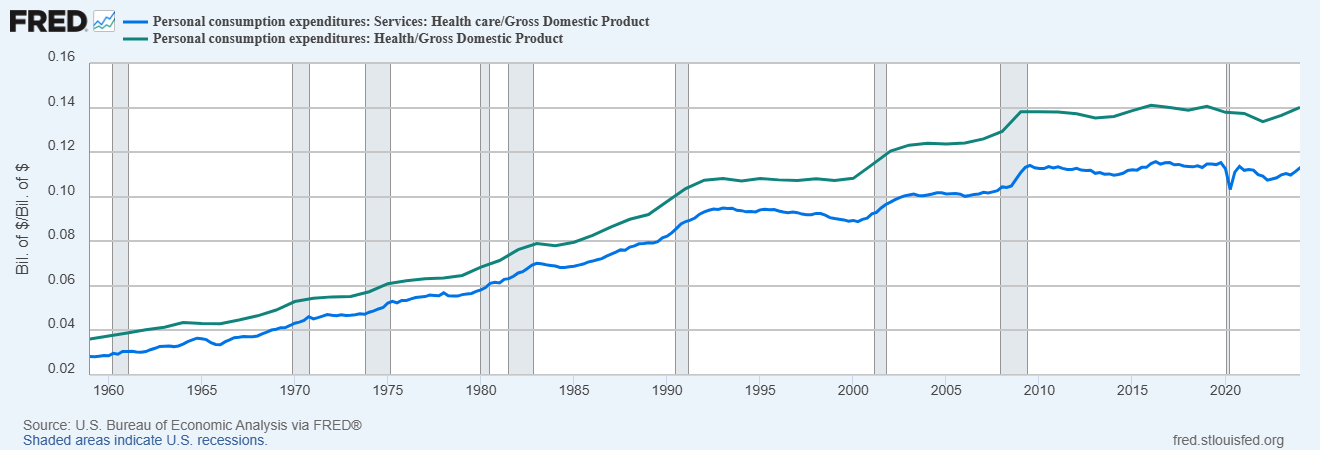
This chart represents us spending more on health care, since it’s a constant percentage of a rising GDP. That’s way better than the previous growing percentage. It is still a high percentage and we are unwise to spend so much.
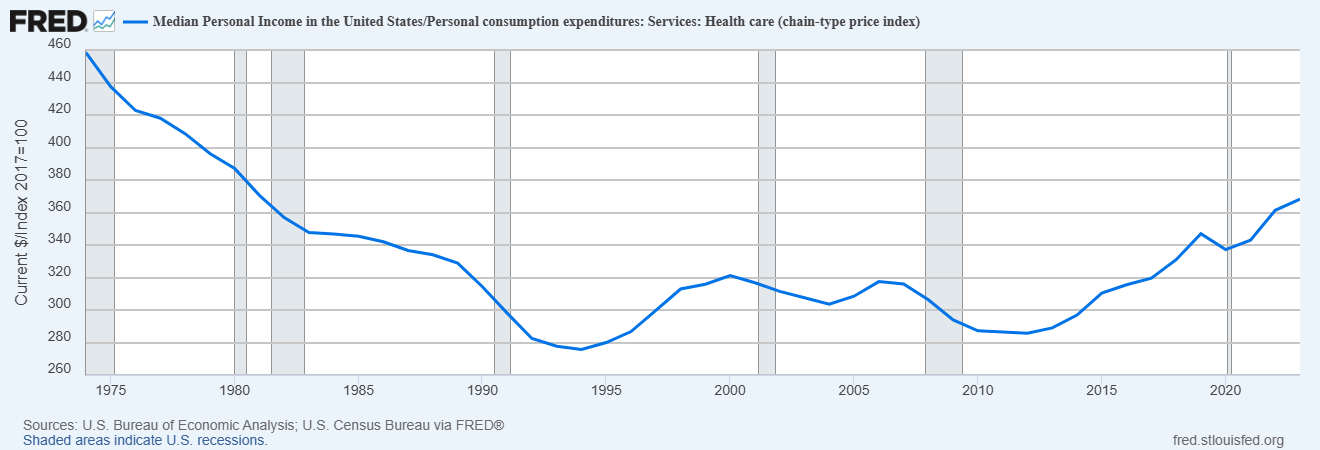
OK but anyway, what we really care about at the end of the day is affordability — i.e., how much health care an average America can buy. A good way of measuring affordability is to look at median income divided by an index of health care prices — in other words, how much health care the typical American can buy with their annual income.
OK, so, this is total spending, not the price of health care. Is America spending less because we’re getting less care? No. In cost-adjusted terms, Americans have been getting more and more health care services over the years.
Importantly, no. We do not primarily care about how much health care an average American can buy and what it costs them.
We primarily care, for this purpose, about how much it costs in practice to get a basket of health care you are in practice allowed or required to buy.
That means buying, or getting as part of your job, acceptable health insurance.
The systems we have in place de facto require you to purchase a lot more health care services, as measured by these charts. It does not seem to be getting us better health.
Noah even says, look, healthcare is getting more affordable overall, even accounting for all the extra healthcare we are forced to buy:
This chart does not reflect true personal consumption expenditures.
As a person forced to buy insurance on the New York marketplace, I do not notice things getting more affordable. Quite the opposite. If you don’t get the subsidies, and you don’t have an employer, buying enough insurance that you can get even basic healthcare services costs an obscene amount. You can’t opt out because if you do they charge you much higher prices.
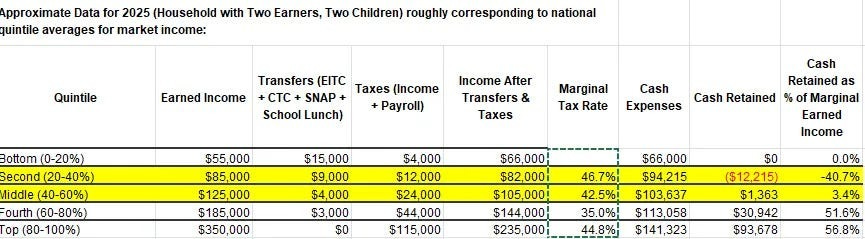
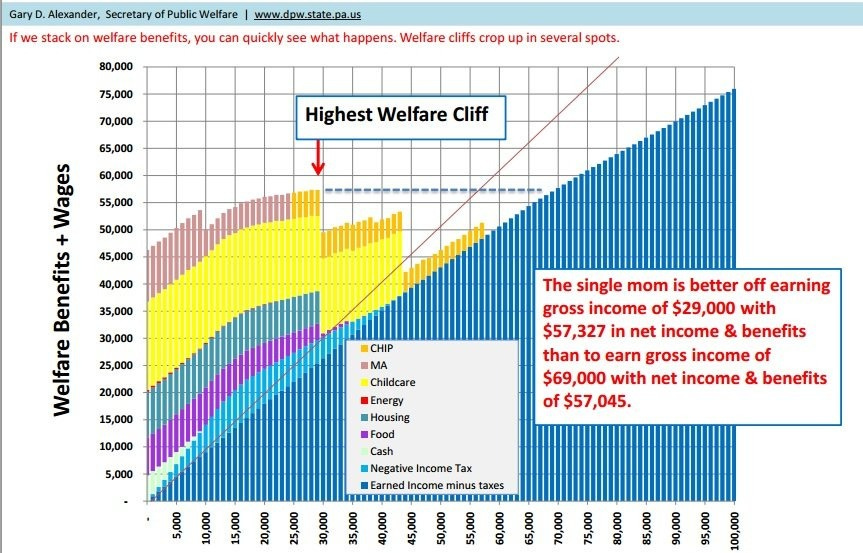
There are two ways out of that. One is that if you are sufficiently struggling they give you heavy subsidies, but you only get that if you are struggling, so this does not help you not struggle and is part of how we effectively trap such people in ~100% marginal tax brackets as per the discussions of the poverty trap. Getting constant government emails saying ‘most people on the exchange pay almost nothing!’ threatens to drive one into a blind rage.
The other way is if you have a job that provides you insurance. Securing this is a severe distortion in many people’s lives, which is a big and rising hidden cost. Either way, you’re massively getting distorted, and that isn’t factored in.
This thing is obscenely expensive and is de facto mandatory. Then we offer various conditional subsidizes and workarounds does not make the cost non-obscene. Then even after you pay you have to navigate the American Healthcare System and force it to provide the healthcare you bought.
The average cost is holding steady as a percentage of income but the uncertainty involved makes it much harder to be comfortable.
It could just be that Americans were willing to pay more for health care as they got richer, up to a point, but that at some point they said “OK, that’s enough.”
I believe the American people mostly would prefer to buy less rights to health care, especially if they don’t get insurance through their work and also even if they do. But the system won’t allow that and their major life choices get distorted by the need to not get crushed by this requirement.
It’s an insane system but we’ve given up on fixing it.
It’s not that much worse than it was in the 1990s, but in the 1990s this was (as I remember it) the big nightmare for average people. It isn’t getting better, yet people have other bigger complaints more often now. That’s not a great spot.
I notice that Noah only discusses higher education here. Lower education costs are definitely out of control, including in the senses that:
-
Public funding for the schools is wildly higher than the cost of teachers, and wildly higher per student, in ways that don’t seem to help kids learn.
-
Public schools are often looking sufficiently unacceptable that people have to opt out even at $0, especially for unusual kids but in many places also in general.
-
Private school costs are crazy high when it comes to that.
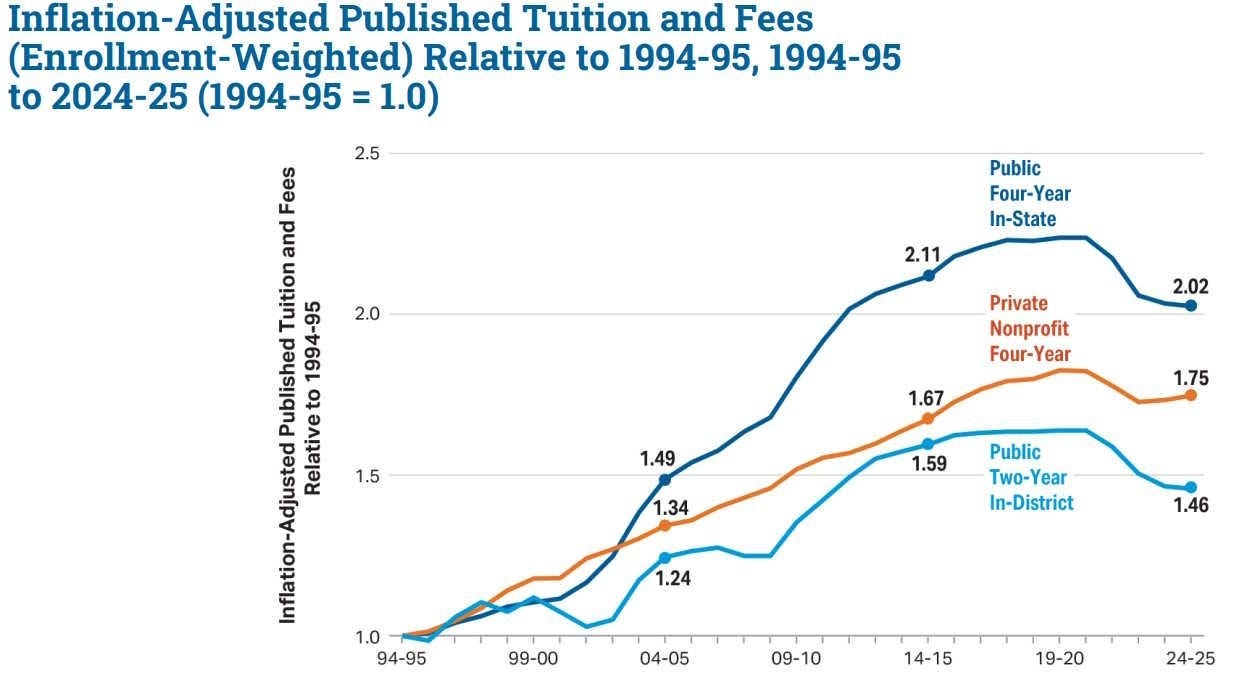
But sure, public primary and secondary school directly costs $0, so let’s focus on college. It does seem true on the base chart that costs leveled off, although at levels that are still a lot higher than in the 1990s, which was already higher than earlier, and also people feel more obligation to do more years of schooling to keep pace which isn’t factored into such charts.
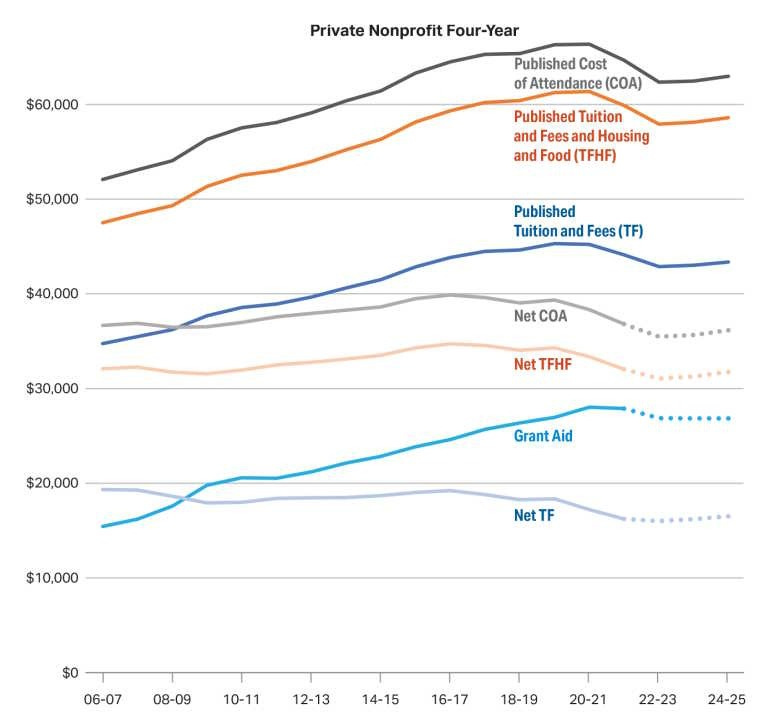
Of course this doesn’t include financial aid (nor does Mark Perry’s chart, nor do official inflation numbers). Financial aid has been going up, especially at private schools. When you include that, it turns out that private four-year nonprofits are actually less expensive in inflation-adjusted terms than they were in the mid-2000s, even without accounting for rising incomes:
I do think people fail to appreciate Noah’s point here, but notice what is happening.
-
We charge a giant sticker price.
-
We force people to jump through hoops, including limiting their income and doing tons of paperwork to navigate systems, and distort their various life choices around all that, in order to get around the sticker price.
-
If you don’t distort your life they try to eat all your (family’s) money.
-
The resulting real price (here net TFHF) remains very high.
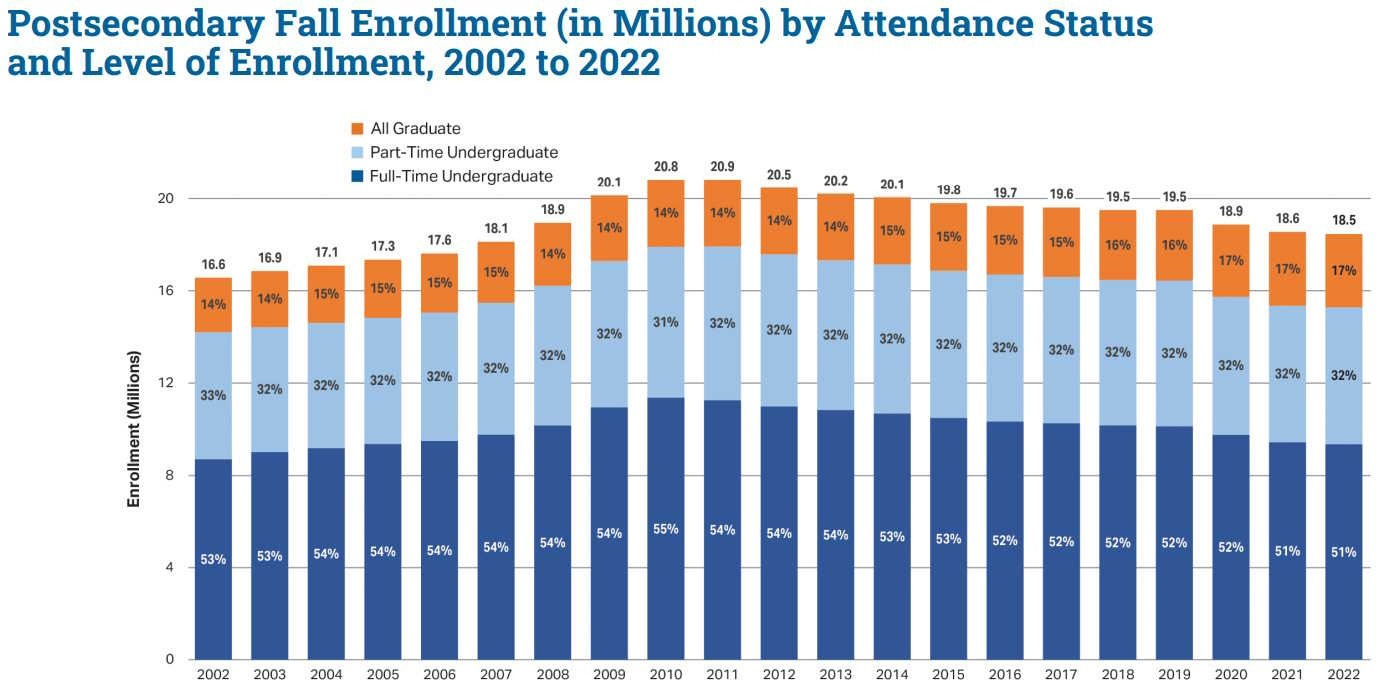
The actual hidden good news is that enrollment is down from peak, so people aren’t facing increasing pressure to do more and more secondary education.
I buy the thesis that higher education costs, while quite terrible, are getting modestly better rather than getting worse, for a given amount of higher education.
The trend is starting to reverse a bit, but it went up rather dramatically before it started to come down, until very recently this was offset by the rise in enrollment and graduation rates, and we force people into various hoops including manipulations of family income levels in order to get this effective cost level, which means that the ‘default’ case is actually quite bad.
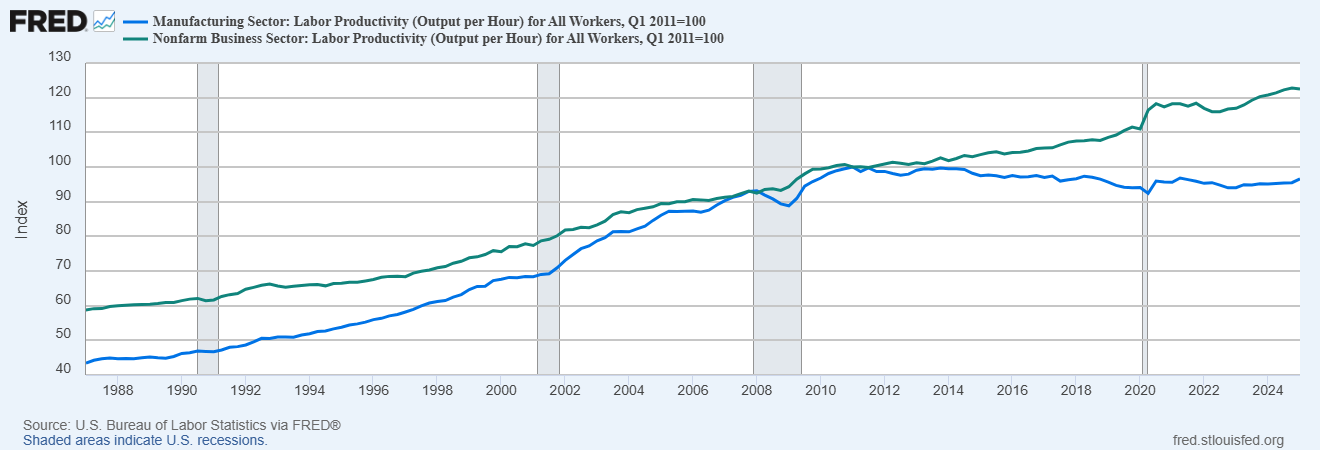
Noah’s big takeaway is that services productivity is indeed rising. I notice that he’s treating the productivity statistics as good measures, which I am increasingly skeptical about, especially claims like manufacturing productivity no longer rising? What? How are all the goods still getting cheaper, exactly?
Noah agrees that even where costs are now stabilized or modestly falling, we haven’t undone the huge cost increases of the past. Mostly I see these statistics as reinforcing the story of the Revolution of Rising Requirements. If services productivity has doubled in the last 50 years, and we feel the need to purchase not only the same quantity of service hours as before but substantially more hours, that makes the situation very clear.
I also would assert that a lot of this new ‘productivity’ is fake in the sense that it does not cash out in things people want. How much ‘productivity’ is going on, for example, in all the new administrative workers in higher education? One can go on.
Ultimately I see the stories as compatible, and this is making me even more skeptical of what the productivity statistics are measuring. This goes hand in hand with the internet and AI showing up everywhere except the productivity statistics. Notice that these graphs don’t seem to bend at all when the internet shows up. We are measuring something useful, but it doesn’t seem to line up well with the amount of useful production going on?
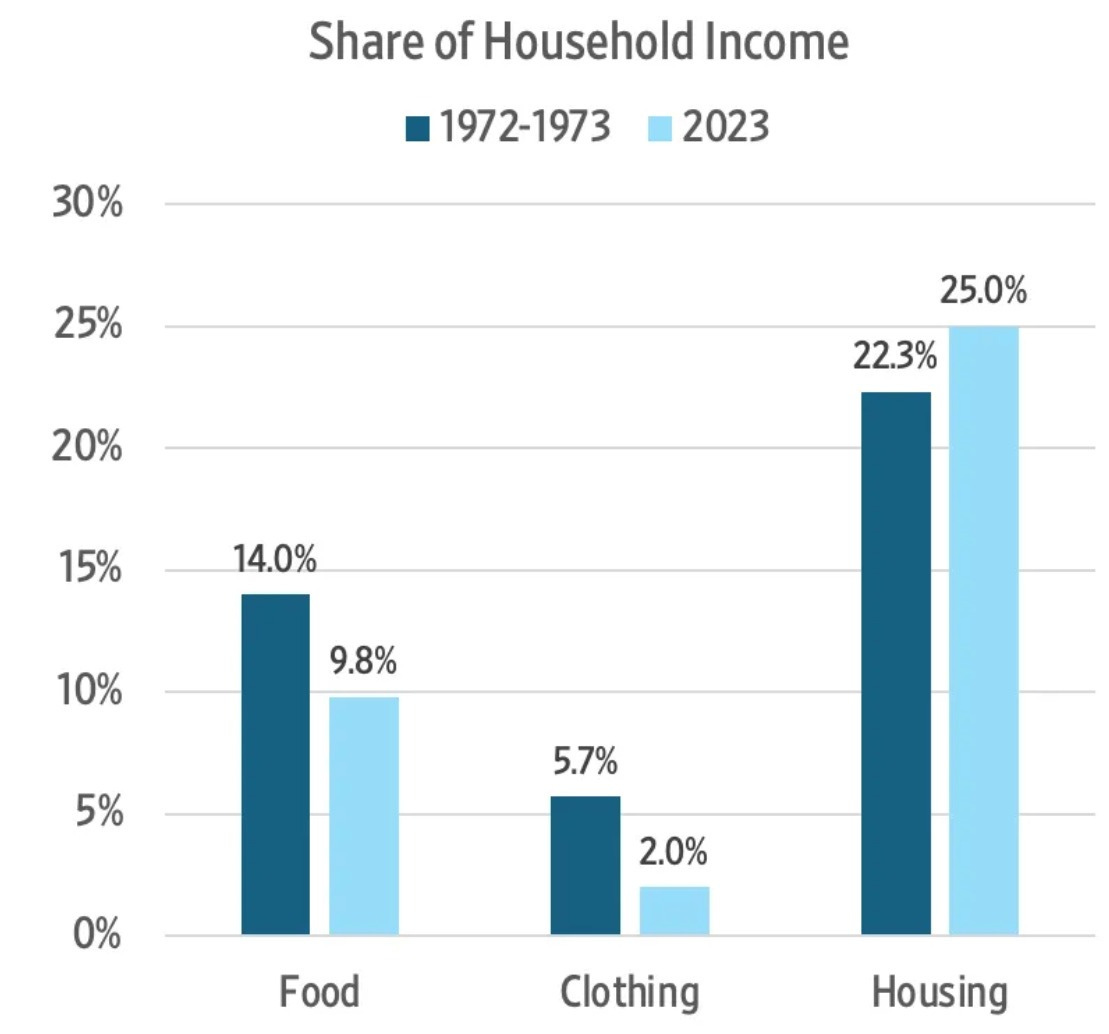
Alex Tabarrok reminds us that modern clothes are dramatically cheaper.
We spend 3% of income on clothes down from 14% in 1900 and 9% in the 1960s. Yes, modern clothes tend to be more flimsy, but it is more efficient this way. The cost of replacing them is priced in and it’s good for clothes to be lightweight.
If you want ‘high quality’ durable and heavier clothes, we will sell them to you, and they’ll still be relatively cheap. And yes, obviously, the government wanting to ‘bring back apparel manufacturing to America’ is utter madness, this is exactly the kind of job you want to outsource.
Related to all this is the question of how much we benefit from free goods? A (gated) paper attempts to quantify this with GDP-B, saying ‘gains from Facebook’ add 0.05%-0.11% to yearly welfare growth and improvements in smartphones add 0.63%. Which would be a huge deal.
Both seem suspiciously high. A bundle of ‘free goods’ only helps me when I care about them. Much of this is positional goods or otherwise not obviously net good for us. You cannot eat smartphone cameras or social media posts.
The free services that do save you money are a different matter. A lot of those have effectively been lost due to atomization.
Here is a recent example of attempting to look away from the problem, in two ways.
-
To shift focus from what it costs to survive to how many goods people buy.
-
To shift focus to demand when we should be focused on supply, as if ‘our supply chains are intact’ means we’re not restricting supply and subsidizing and mandating demand.
Tyler Cowen: Most of all, there is a major conceptual error in Green’s focus on high prices. To the extent that prices are high, it is not because our supply chains have been destroyed by earthquakes or nuclear bombs.
Rather, prices are high in large part because demand is high, which can only happen because so many more Americans can afford to buy things.
I am reminded of the old Yogi Berra saying: “Nobody goes there anymore. It’s too crowded.”
I challenge. This is not primarily a demand side issue.
Over time supply should be elastic. Shouldn’t we assume we have a supply side issue?
What are the goods that Americans need, that have truly fixed supply that shouldn’t be elastic in the face of wealth gains and generational demand shifts? Where is this not mostly a self-inflicted wound?
The answer to that is positional goods. Saying ‘look at how much more positional goods everyone is buying’ is not exactly an answer that should make anyone happy. If everyone is forced to consume more educational or other signaling, that’s worse.
The biggest causes of high prices on non-positional goods are supply side restrictions, especially on housing and also other key services with government restrictions on production and often subsidized or mandated demand to boot. Yes, to some extent housing is a positional good as well, but we are nowhere near where that constraint should be binding us. I presume Tyler Cowen would violently agree.
When solving for the equilibrium, rising demand for a good causing higher prices should be highly suspicious. Supply tends to be remarkably elastic in the medium term, why is that not fixing the issue? If we’re so rich, why don’t you increase production? Something must be preventing you from doing so.
Often the answer is indeed supply restrictions. In some of the remaining cases you can say Baumol’s Cost Disease. In many others, you can’t. Or you can partially blame Baumol but then you have to ask why we need so much labor per person to produce necessary goods. It’s not like the labor got worse.
The burdens placed are often part of the Revolution of Rising Requirements.
Even if Tyler Cowen was entirely correct here? It does not change the key factor. Americans buying lots of things is good, but it does not impact how hard it is to make ends meet.
It is not a conceptual error to then focus on high prices, if prices are relevantly high.
It is especially right to focus on high prices if quality requirements for necessary goods have been raised, which in turn raised prices.
We also need to look at generational wealth levels. We constantly play and hear the ‘generation wealth level’ game, which is mainly about how old people are, and secondarily about home and stock price appreciation, and there was never that much story there to begin with, the gaps were always small?
The latest news is that Millennials, contrary to general impressions, are now out in front in ‘real dollar’ terms for both income and wealth, and their combined spending on housing, food and clothing continues to decline as a percentage of income.
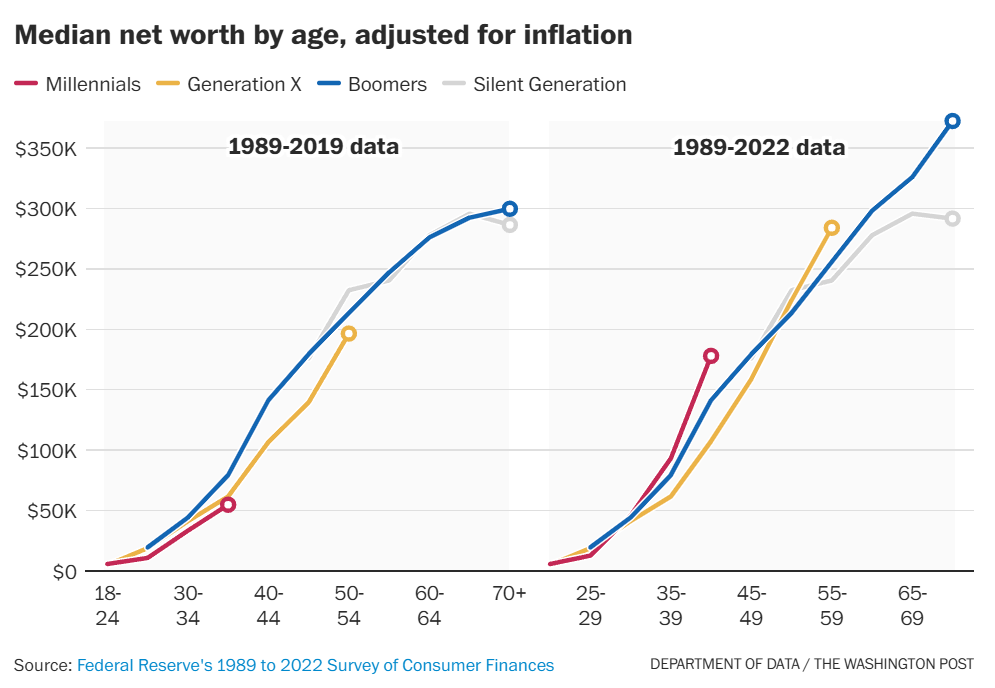
The bad news is that if you think of wealth as a percentage of the cost of a house, then that calculation looks a lot worse.
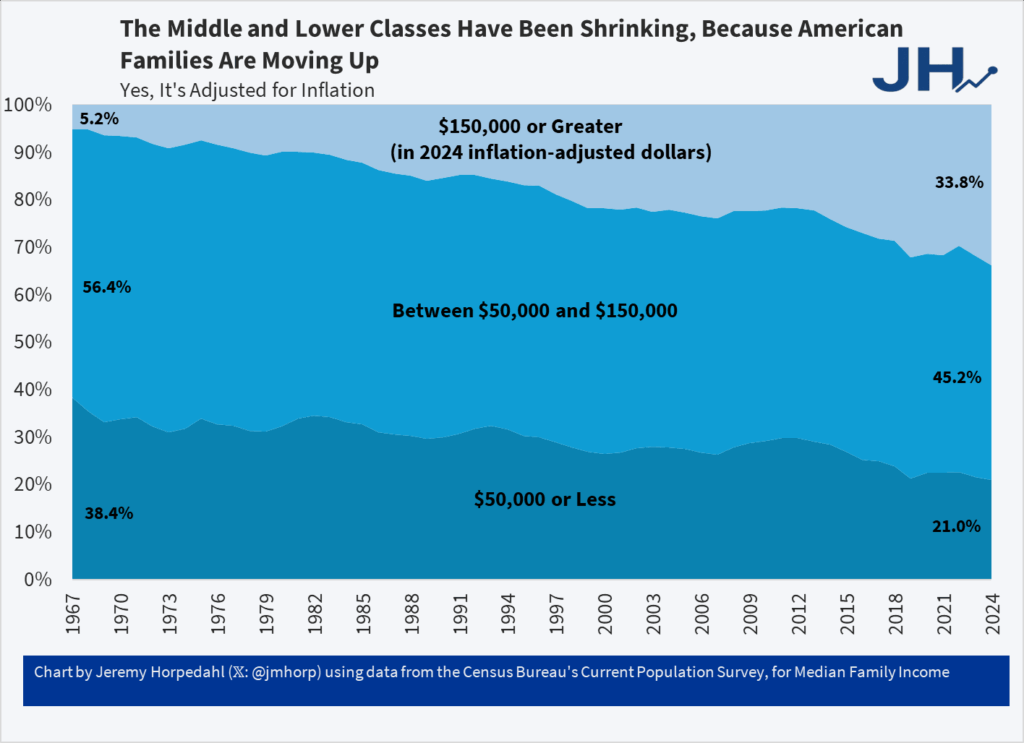
Similarly, this is the classic graph on income, adjusted for inflation, after taxes and transfers, showing Gen Z is making more money:
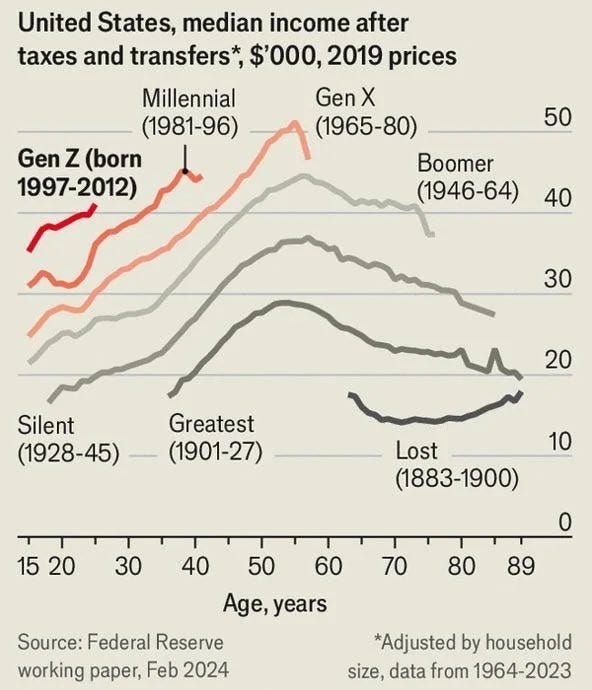
Matthew Yglesias: An annoying aspect of the new political alignment is it’s hard to tell whether a given factually inaccurate declining narrative is coming from a left-wing or right-wing perspective.
Zac Hill: Right, and it’s precisely the *expectationscreated by these skyrocketing increases which is a major cause of this misplaced sense of decline.
Illustrious Wasp (being wrong): This is graph is straight up propaganda. Inflation hasn’t been actually measured for decades. Purchasing power is the lowest its ever been. Rent, food, and necessities are the highest fraction of income ever since the great depression and possibly even higher. The average American has literally zero dollars in their bank account and is living paycheck to paycheck.
Hunter: No.
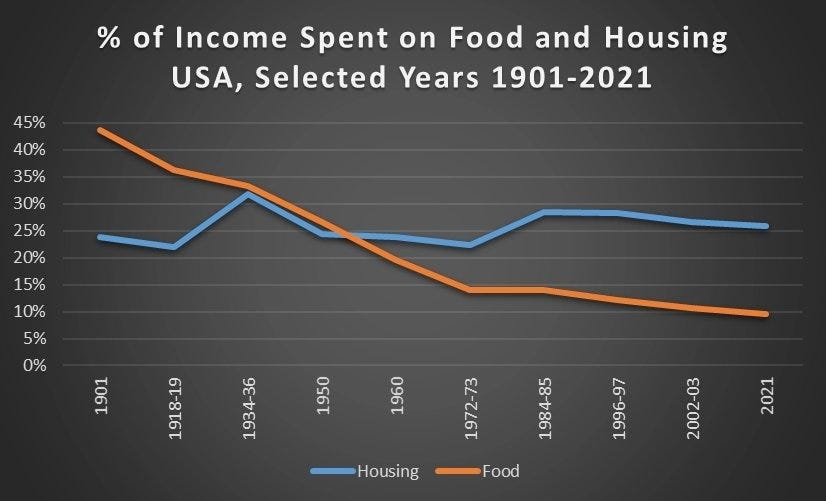
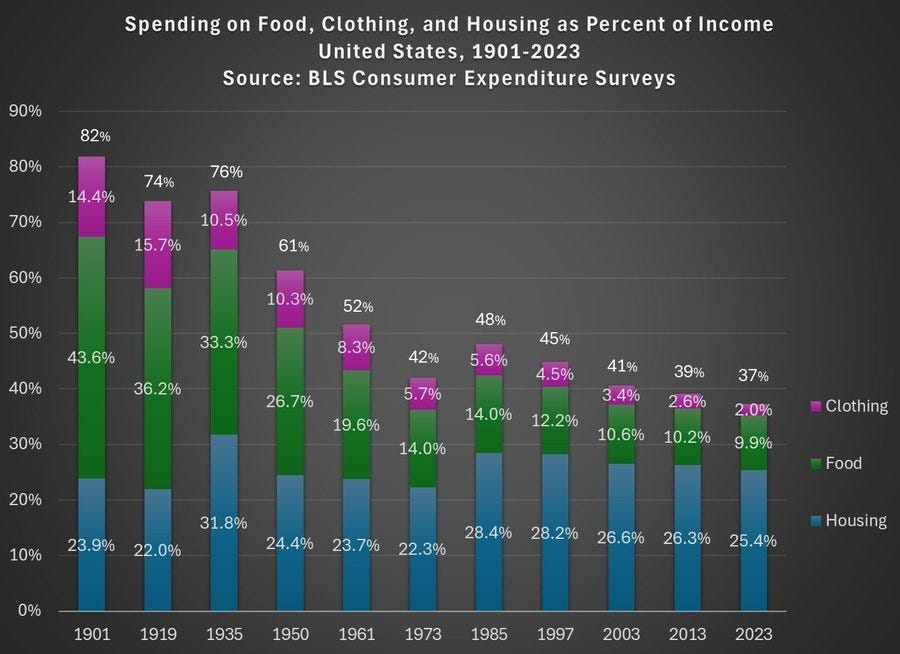
Also, similarly, we have this:
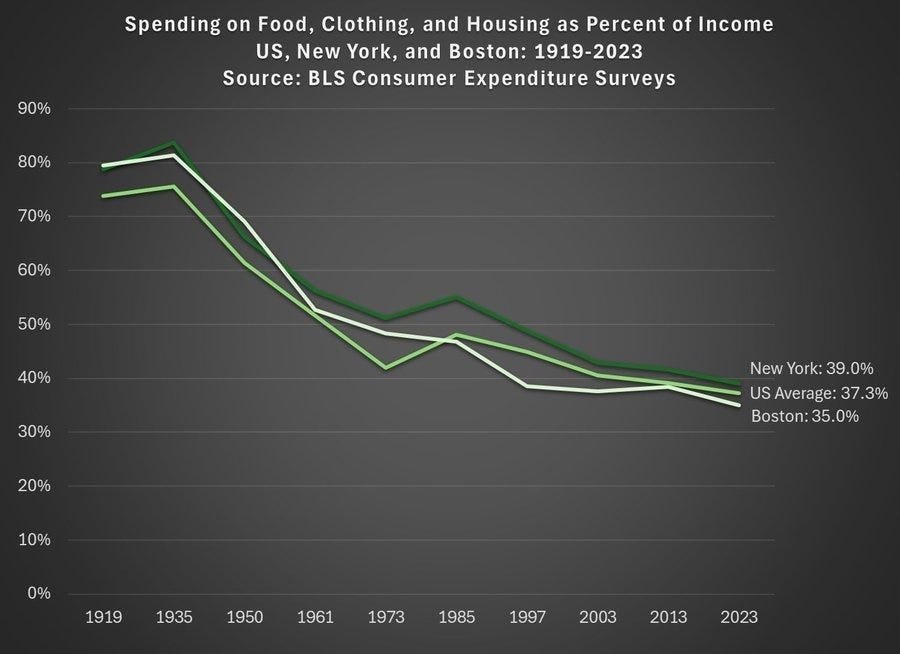
Jeremy Horpedahl: The share of income spent on food, clothing, and housing in the has declined dramatically since 1901 in the United States. It’s even lower than in 1973, which many claim is the beginning of economic stagnation.
Bonus chart: if you are worried that the national average obscures regional differences, here is similar long-term data for New York and Boston
Such threads are always filled with people who do not believe any of it. The numbers must be wrong. Everyone is lying about inflation. Assertions of ‘misinformation’ and ‘debunked’ without evidence.
I strongly believe the numbers are right. One must then figure out what that means.
Are you more wealthy than a khan?
Ben Dreyfuss: So many tweets on this website are people describing the almost unimaginable level of comfort and prosperity enjoyed in this country and then being like “but it sucks” haha
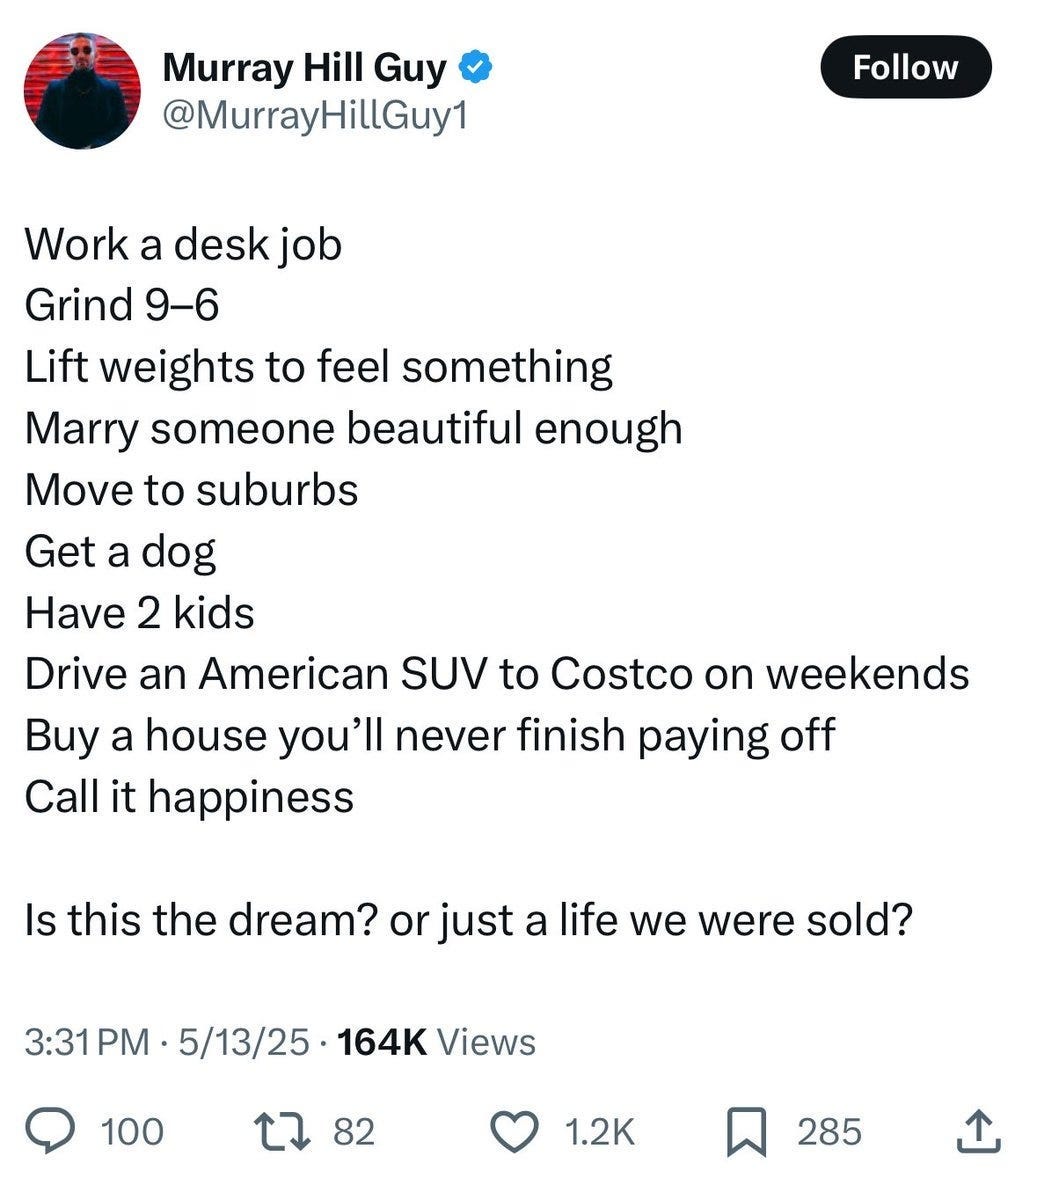
Jane Coaston: this is American Beauty thinking, I was pretty sure we solved this with the Great Recession, and yet here we are, still believing that “a good life your ancestors died for” is secretly bad because you’re on the brink of death all the time
if you want to experience the very edge of human suffering you could just run an ultra like a normal person. Not to sound like a parent but if you would like to suffer to feel something boy do I have some ideas.
if you have a house, a spouse, and a Costco membership, you are more wealthy than actual khans of the ancient past
Mungowitz: Two things:
-
[The claim about being more wealthy than actual khans] is so obviously true that I can’t see why it is not just universally believed.
-
No one believes it.
I instead say: It is obviously true in a material wealth and comfort sense excluding ability to find companions or raise children, and no one believes it because that’s not the relevant comparison and they’re not drawing the distinction precisely.
There is a big difference between material wealth and comfort, and what is good or valuable in life. That’s the disconnect. Yes, in terms of material goods in an absolute sense you are vastly richer than the Khans. You are vastly safer and healthier than them, with a vastly higher life expectancy. You better recognize.
That doesn’t mean you are better off than a Khan. Even if you don’t care about status and ability to boss people around, or other ways in which it is ‘good to be the king,’ and we focus only on material wealth, you are especially not better off in the most important respect. Which is that, once again, your material wealth will still struggle to support a family and children, or to feel secure and able to not stress about money, and most people feel constrained by money in how many children they can have.
A Khan had the most important amount of wealth for personal use, which is ‘enough.’
What does it say about us if we are both materially more wealthy than a Khan, and that we are not allowed, culturally or legally, to turn that wealth into a large family?
Throughout, we see the combination of three trends:
-
People are making more money, and ending up with more wealth at a given age.
-
Real costs in these areas are rising more than they should be, but not substantially higher than real incomes.
-
This identifies important problems, but does not explain people’s unhappiness and felt inability to succeed or be in position to raise a family. More is happening.
As I said up top, the economists are right about the facts. Claims to the contrary are wrong. But those facts do not mean what the economists understand them to mean. They do not mean that Guy is not miserable or his life is not harder, or that Guy can afford his hometown, or to raise a family.
Whereas real wages have gone up a lot, so Guy’s life should be easier. Why isn’t it?
My answer, the thing I’m centrally building towards, is that this doesn’t represent the full range of costs and cost changes, centrally for two reasons: The Revolutions of Rising Expectations and Rising Requirements.
Discussion about this post
The $140K Question: Cost Changes Over Time Read More »