seismology

“like-putting-on-glasses-for-the-first-time”—how-ai-improves-earthquake-detection

“Like putting on glasses for the first time”—how AI improves earthquake detection


AI is “comically good” at detecting small earthquakes—here’s why that matters.

Credit: Aurich Lawson | Getty Images

On January 1, 2008, at 1: 59 am in Calipatria, California, an earthquake happened. You haven’t heard of this earthquake; even if you had been living in Calipatria, you wouldn’t have felt anything. It was magnitude -0.53, about the same amount of shaking as a truck passing by. Still, this earthquake is notable, not because it was large but because it was small—and yet we know about it.

Over the past seven years, AI tools based on computer imaging have almost completely automated one of the fundamental tasks of seismology: detecting earthquakes. What used to be the task of human analysts—and later, simpler computer programs—can now be done automatically and quickly by machine-learning tools.

These machine-learning tools can detect smaller earthquakes than human analysts, especially in noisy environments like cities. Earthquakes give valuable information about the composition of the Earth and what hazards might occur in the future.

“In the best-case scenario, when you adopt these new techniques, even on the same old data, it’s kind of like putting on glasses for the first time, and you can see the leaves on the trees,” said Kyle Bradley, co-author of the Earthquake Insights newsletter.

I talked with several earthquake scientists, and they all agreed that machine-learning methods have replaced humans for the better in these specific tasks.

“It’s really remarkable,” Judith Hubbard, a Cornell University professor and Bradley’s co-author, told me.

Less certain is what comes next. Earthquake detection is a fundamental part of seismology, but there are many other data processing tasks that have yet to be disrupted. The biggest potential impacts, all the way to earthquake forecasting, haven’t materialized yet.

“It really was a revolution,” said Joe Byrnes, a professor at the University of Texas at Dallas. “But the revolution is ongoing.”

When an earthquake happens in one place, the shaking passes through the ground, similar to how sound waves pass through the air. In both cases, it’s possible to draw inferences about the materials the waves pass through.

Imagine tapping a wall to figure out if it’s hollow. Because a solid wall vibrates differently than a hollow wall, you can figure out the structure by sound.

With earthquakes, this same principle holds. Seismic waves pass through different materials (rock, oil, magma, etc.) differently, and scientists use these vibrations to image the Earth’s interior.

The main tool that scientists traditionally use is a seismometer. These record the movement of the Earth in three directions: up–down, north–south, and east–west. If an earthquake happens, seismometers can measure the shaking in that particular location.

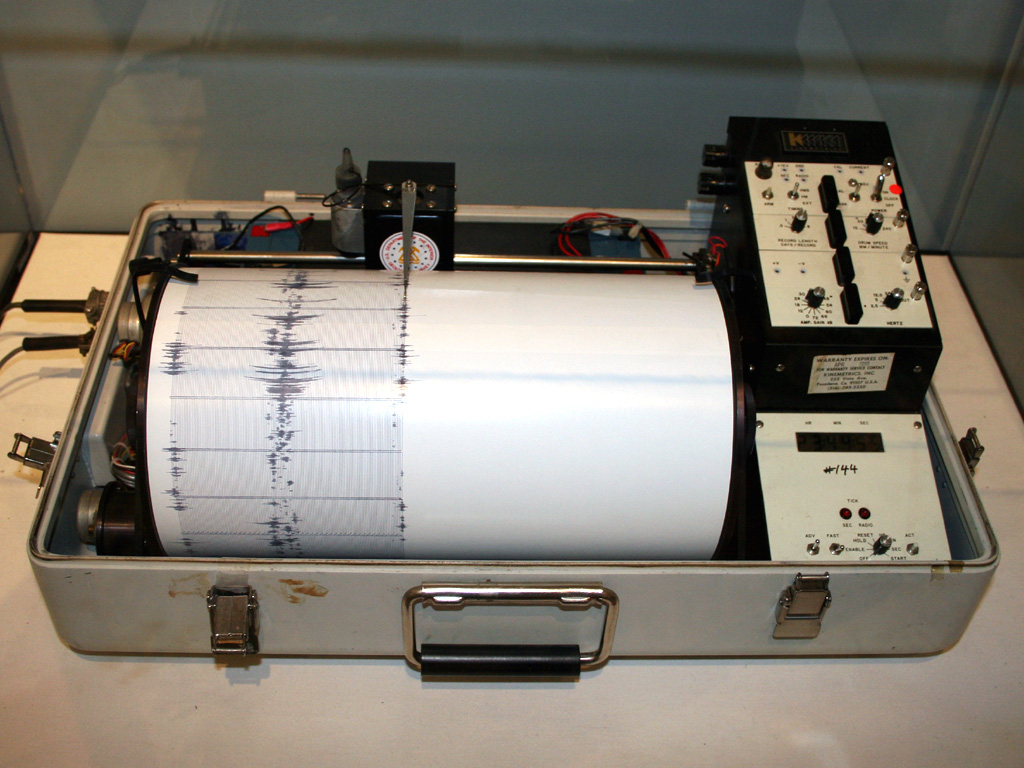
An old-fashioned physical seismometer. Today, seismometers record data digitally. Credit: Yamaguchi先生 on Wikimedia CC BY-SA 3.0

Scientists then process raw seismometer information to identify earthquakes.

Earthquakes produce multiple types of shaking, which travel at different speeds. Two types, Primary (P) waves and Secondary (S) waves are particularly important, and scientists like to identify the start of each of these phases.

Before good algorithms, earthquake cataloging had to happen by hand. Byrnes said that “traditionally, something like the lab at the United States Geological Survey would have an army of mostly undergraduate students or interns looking at seismograms.”

However, there are only so many earthquakes you can find and classify manually. Creating algorithms to effectively find and process earthquakes has long been a priority in the field—especially since the arrival of computers in the early 1950s.

“The field of seismology historically has always advanced as computing has advanced,” Bradley told me.

There’s a big challenge with traditional algorithms, though: They can’t easily find smaller quakes, especially in noisy environments.

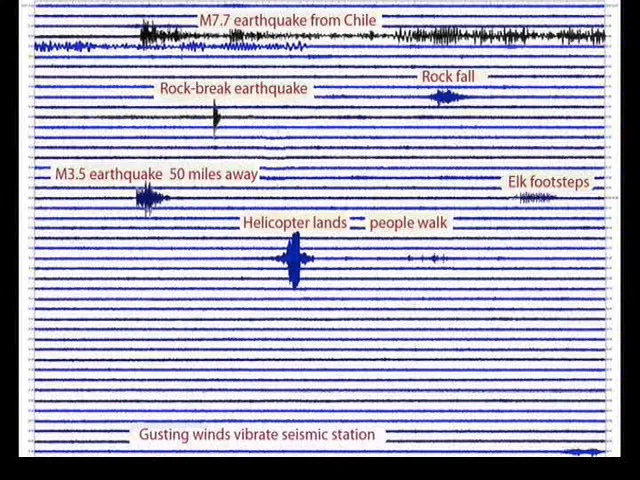
Composite seismogram of common events. Note how each event has a slightly different shape. Credit: EarthScope Consortium CC BY 4.0

As we see in the seismogram above, many different events can cause seismic signals. If a method is too sensitive, it risks falsely detecting events as earthquakes. The problem is especially bad in cities, where the constant hum of traffic and buildings can drown out small earthquakes.

However, earthquakes have a characteristic “shape.” The magnitude 7.7 earthquake above looks quite different from the helicopter landing, for instance.

So one idea scientists had was to make templates from human-labeled datasets. If a new waveform correlates closely with an existing template, it’s almost certainly an earthquake.

Template matching works very well if you have enough human-labeled examples. In 2019, Zach Ross’ lab at Caltech used template matching to find 10 times as many earthquakes in Southern California as had previously been known, including the earthquake at the start of this story. Almost all of the new 1.6 million quakes they found were very small, magnitude 1 and below.

If you don’t have an extensive pre-existing dataset of templates, however, you can’t easily apply template matching. That isn’t a problem in Southern California—which already had a basically complete record of earthquakes down to magnitude 1.7—but it’s a challenge elsewhere.

Also, template matching is computationally expensive. Creating a Southern California quake dataset using template matching took 200 Nvidia P100 GPUs running for days on end.

There had to be a better way.

AI detection models solve all of these problems:

  • They are faster than template matching.

  • Because AI detection models are very small (around 350,000 parameters compared to billions in LLMs like GPT4.0), they can be run on consumer CPUs.

  • AI models generalize well to regions not represented in the original dataset.

As an added bonus, AI models can give better information about when the different types of earthquake shaking arrive. Timing the arrivals of the two most important waves—P and S waves—is called phase picking. It allows scientists to draw inferences about the structure of the quake. AI models can do this alongside earthquake detection.

The basic task of earthquake detection (and phase picking) looks like this:

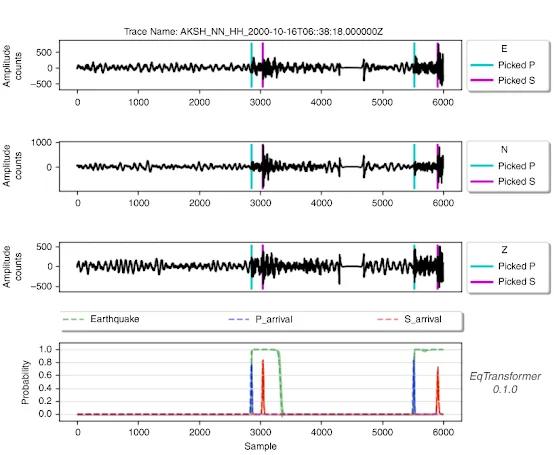
Cropped figure from Earthquake Transformer—an attentive deep-learning model for simultaneous earthquake detection and phase picking. Credit: Nature Communications

The first three rows represent different directions of vibration (east–west, north–south, and up–down respectively). Given these three dimensions of vibration, can we determine if an earthquake occurred, and if so, when it started?

We want to detect the initial P wave, which arrives directly from the site of the earthquake. But this can be tricky because echoes of the P wave may get reflected off other rock layers and arrive later, making the waveform more complicated.

Ideally, then, our model outputs three things at every time step in the sample:

  1. The probability that an earthquake is occurring at that moment.

  2. The probability that the first P wave arrives at that moment.

  3. The probability that the first S wave arrives at that moment.

We see all three outputs in the fourth row: the detection in green, the P wave arrival in blue, and the S wave arrival in red. (There are two earthquakes in this sample.)

To train an AI model, scientists take large amounts of labeled data, like what’s above, and do supervised training. I’ll describe one of the most used models: Earthquake Transformer, which was developed around 2020 by a Stanford University team led by S. Mostafa Mousavi, who later became a Harvard professor.

Like many earthquake detection models, Earthquake Transformer adapts ideas from image classification. Readers may be familiar with AlexNet, a famous image-recognition model that kicked off the deep-learning boom in 2012.

AlexNet used convolutions, a neural network architecture that’s based on the idea that pixels that are physically close together are more likely to be related. The first convolutional layer of AlexNet broke an image down into small chunks—11 pixels on a side—and classified each chunk based on the presence of simple features like edges or gradients.

The next layer took the first layer’s classifications as input and checked for higher-level concepts such as textures or simple shapes.

Each convolutional layer analyzed a larger portion of the image and operated at a higher level of abstraction. By the final layers, the network was looking at the entire image and identifying objects like “mushroom” and “container ship.”

Images are two-dimensional, so AlexNet is based on two-dimensional convolutions. By contrast, seismograph data is one-dimensional, so Earthquake Transformer uses one-dimensional convolutions over the time dimension. The first layer analyzes vibration data in 0.1-second chunks, while later layers identify patterns over progressively longer time periods.

It’s difficult to say what exact patterns the earthquake model is picking out, but we can analogize this to a hypothetical audio transcription model using one-dimensional convolutions. That model might first identify consonants, then syllables, then words, then sentences over increasing time scales.

Earthquake Transformer converts raw waveform data into a collection of high-level representations that indicate the likelihood of earthquakes and other seismologically significant events. This is followed by a series of deconvolution layers that pinpoint exactly when an earthquake—and its all-important P and S waves—occurred.

The model also uses an attention layer in the middle of the model to mix information between different parts of the time series. The attention mechanism is most famous in large language models, where it helps pass information between words. It plays a similar role in seismographic detection. Earthquake seismograms have a general structure: P waves followed by S waves followed by other types of shaking. So if a segment looks like the start of a P wave, the attention mechanism helps it check that it fits into a broader earthquake pattern.

All of the Earthquake Transformer’s components are standard designs from the neural network literature. Other successful detection models, like PhaseNet, are even simpler. PhaseNet uses only one-dimensional convolutions to pick the arrival times of earthquake waves. There are no attention layers.

Generally, there hasn’t been “much need to invent new architectures for seismology,” according to Byrnes. The techniques derived from image processing have been sufficient.

What made these generic architectures work so well then? Data. Lots of it.

Ars has previously reported on how the introduction of ImageNet, an image recognition benchmark, helped spark the deep learning boom. Large, publicly available earthquake datasets have played a similar role in seismology.

Earthquake Transformer was trained using the Stanford Earthquake Dataset (STEAD), which contains 1.2 million human-labeled segments of seismogram data from around the world. (The paper for STEAD explicitly mentions ImageNet as an inspiration). Other models, like PhaseNet, were also trained on hundreds of thousands or millions of labeled segments.

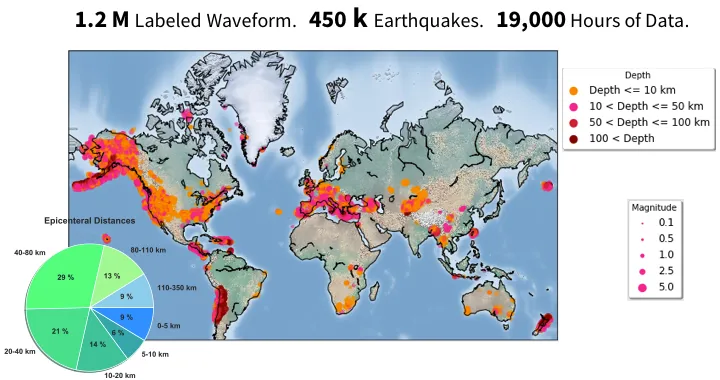
All recorded earthquakes in the Stanford Earthquake Dataset. Credit: IEEE (CC BY 4.0)

The combination of the data and the architecture just works. The current models are “comically good” at identifying and classifying earthquakes, according to Byrnes. Typically, machine-learning methods find 10 or more times the quakes that were previously identified in an area. You can see this directly in an Italian earthquake catalog:

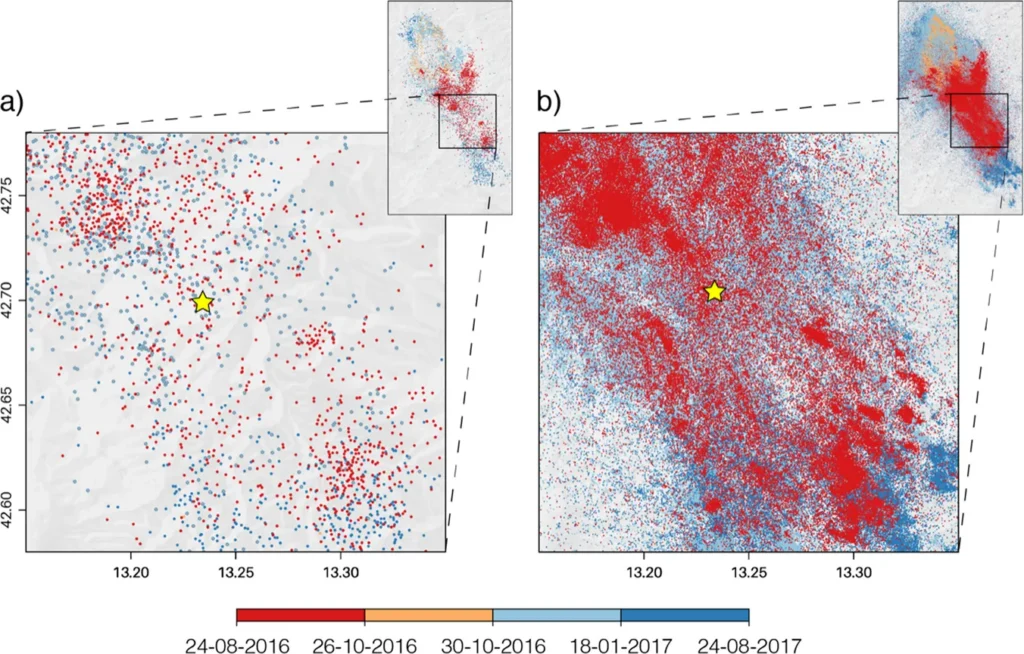
From Machine learning and earthquake forecasting—next steps by Beroza et al. Credit: Nature Communications (CC-BY 4.0)

AI tools won’t necessarily detect more earthquakes than template matching. But AI-based techniques are much less compute- and labor-intensive, making them more accessible to the average research project and easier to apply in regions around the world.

All in all, these machine-learning models are so good that they’ve almost completely supplanted traditional methods for detecting and phase-picking earthquakes, especially for smaller magnitudes.

The holy grail of earthquake science is earthquake prediction. For instance, scientists know that a large quake will happen near Seattle but have little ability to know whether it will happen tomorrow or in a hundred years. It would be helpful if we could predict earthquakes precisely enough to allow people in affected areas to evacuate.

You might think AI tools would help predict earthquakes, but that doesn’t seem to have happened yet.

The applications are more technical and less flashy, said Cornell’s Judith Hubbard.

Better AI models have given seismologists much more comprehensive earthquake catalogs, which have unlocked “a lot of different techniques,” Bradley said.

One of the coolest applications is in understanding and imaging volcanoes. Volcanic activity produces a large number of small earthquakes, whose locations help scientists understand the structure of the magma system. In a 2022 paper, John Wilding and co-authors used a large AI-generated earthquake catalog to create this incredible image of the structure of the Hawaiian volcanic system.

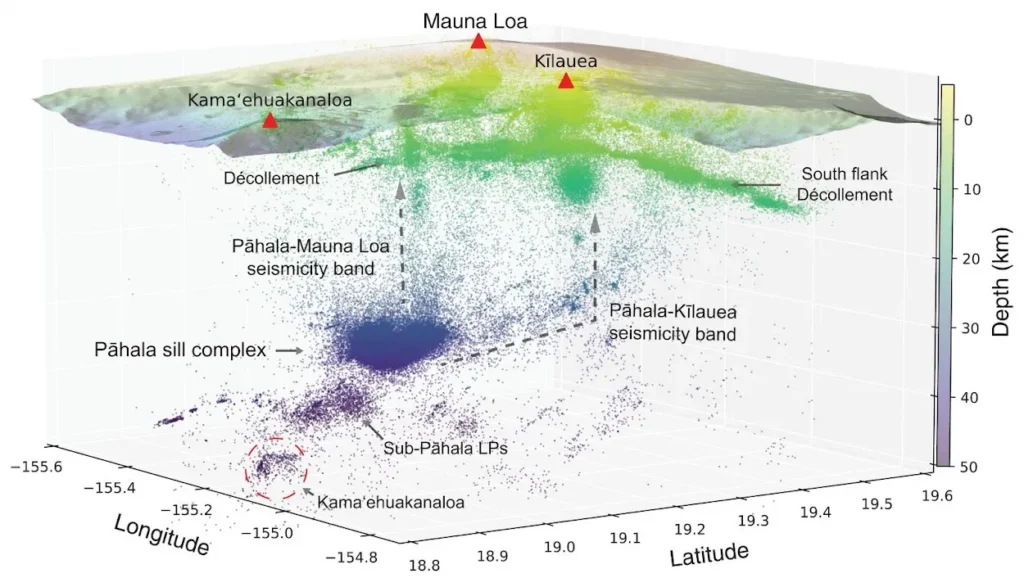
Each dot represents an individual earthquake. Credit: Wilding et al., The magmatic web beneath Hawai‘i.

They provided direct evidence of a previously hypothesized magma connection between the deep Pāhala sill complex and Mauna Loa’s shallow volcanic structure. You can see this in the image with the arrow labeled as Pāhala-Mauna Loa seismicity band. The authors were also able to clarify the structure of the Pāhala sill complex into discrete sheets of magma. This level of detail could potentially facilitate better real-time monitoring of earthquakes and more accurate eruption forecasting.

Another promising area is lowering the cost of dealing with huge datasets. Distributed Acoustic Sensing (DAS) is a powerful technique that uses fiber-optic cables to measure seismic activity across the entire length of the cable. A single DAS array can produce “hundreds of gigabytes of data” a day, according to Jiaxuan Li, a professor at the University of Houston. That much data can produce extremely high-resolution datasets—enough to pick out individual footsteps.

AI tools make it possible to very accurately time earthquakes in DAS data. Before the introduction of AI techniques for phase picking in DAS data, Li and some of his collaborators attempted to use traditional techniques. While these “work roughly,” they weren’t accurate enough for their downstream analysis. Without AI, much of his work would have been “much harder,” he told me.

Li is also optimistic that AI tools will be able to help him isolate “new types of signals” in the rich DAS data in the future.

Not all AI techniques have paid off

As in many other scientific fields, seismologists face some pressure to adopt AI methods, whether or not they are relevant to their research.

“The schools want you to put the word AI in front of everything,” Byrnes said. “It’s a little out of control.”

This can lead to papers that are technically sound but practically useless. Hubbard and Bradley told me that they’ve seen a lot of papers based on AI techniques that “reveal a fundamental misunderstanding of how earthquakes work.”

They pointed out that graduate students can feel pressure to specialize in AI methods at the cost of learning less about the fundamentals of the scientific field. They fear that if this type of AI-driven research becomes entrenched, older methods will get “out-competed by a kind of meaninglessness.”

While these are real issues, and ones Understanding AI has reported on before, I don’t think they detract from the success of AI earthquake detection. In the last five years, an AI-based workflow has almost completely replaced one of the fundamental tasks in seismology for the better.

That’s pretty cool.

Kai Williams is a reporter for Understanding AI, a Substack newsletter founded by Ars Technica alum Timothy B. Lee. His work is supported by a Tarbell Fellowship. Subscribe to Understanding AI to get more from Tim and Kai.

“Like putting on glasses for the first time”—how AI improves earthquake detection Read More »

how-android-phones-became-an-earthquake-warning-system

How Android phones became an earthquake warning system

Of course, the trick is that you only send out the warning if there’s an actual earthquake, and not when a truck is passing by. Here, the sheer volume of Android phones sold plays a key role. As a first pass, AEA can simply ignore events that aren’t picked up by a lot of phones in the same area. But we also know a lot about the patterns of shaking that earthquakes produce. Different waves travel at different speeds, cause different types of ground motion, and may be produced at different intensities as the earthquake progresses.

So, the people behind AEA also include a model of earthquakes and seismic wave propagation, and check whether the pattern seen in phones’ accelerometers is consistent with that model. It only triggers an alert when there’s widespread phone activity that matches the pattern expected for an earthquake.

Raising awareness

In practical terms, AEA is distributed as part of the core Android software, and is set to on by default, so it is active in most Android phones. It starts monitoring when the phone has been stationary for a little while, checking for acceleration data that’s consistent with the P or S waves produced by earthquakes. If it gets a match, it forwards the information along with some rough location data (to preserve privacy) to Google servers. Software running on those servers then performs the positional analysis to see if the waves are widespread enough to have been triggered by an earthquake.

If so, it estimates the size and location, and uses that information to estimate the ground motion that will be experienced in different locations. Based on that, AEA sends out one of two alerts, either “be aware” or “take action.” The “be aware” alert is similar to a standard Android notification, but it plays a distinctive sound and is sent to users further from the epicenter. In contrast, the “take action” warning that’s sent to those nearby will display one of two messages in the appropriate language, either “Protect yourself” or “Drop, cover, and hold on.” It ignores any do-not-disturb settings, takes over the entire screen, and also plays a distinct noise.

How Android phones became an earthquake warning system Read More »

bizarre,-nine-day-seismic-signal-caused-by-epic-landslide-in-greenland

Bizarre, nine-day seismic signal caused by epic landslide in Greenland

Big splash —

Unidentified seismic object resulted in skyscraper-high tsunami.

Ice calving from a glacier

Earthquake scientists detected an unusual signal on monitoring stations used to detect seismic activity during September 2023. We saw it on sensors everywhere, from the Arctic to Antarctica.

We were baffled—the signal was unlike any previously recorded. Instead of the frequency-rich rumble typical of earthquakes, this was a monotonous hum, containing only a single vibration frequency. Even more puzzling was that the signal kept going for nine days.

Initially classified as a “USO”—an unidentified seismic object—the source of the signal was eventually traced back to a massive landslide in Greenland’s remote Dickson Fjord. A staggering volume of rock and ice, enough to fill 10,000 Olympic-sized swimming pools, plunged into the fjord, triggering a 200-meter-high mega-tsunami and a phenomenon known as a seiche: a wave in the icy fjord that continued to slosh back and forth, some 10,000 times over nine days.

To put the tsunami in context, that 200-meter wave was double the height of the tower that houses Big Ben in London and many times higher than anything recorded after massive undersea earthquakes in Indonesia in 2004 (the Boxing Day tsunami) or Japan in 2011 (the tsunami which hit Fukushima nuclear plant). It was perhaps the tallest wave anywhere on Earth since 1980.

Our discovery, now published in the journal Science, relied on collaboration with 66 other scientists from 40 institutions across 15 countries. Much like an air crash investigation, solving this mystery required putting many diverse pieces of evidence together, from a treasure trove of seismic data, to satellite imagery, in-fjord water level monitors, and detailed simulations of how the tsunami wave evolved.

This all highlighted a catastrophic, cascading chain of events, from decades to seconds before the collapse. The landslide traveled down a very steep glacier in a narrow gully before plunging into a narrow, confined fjord. Ultimately, though, it was decades of global heating that had thinned the glacier by several tens of meters, meaning that the mountain towering above it could no longer be held up.

Uncharted waters

But beyond the weirdness of this scientific marvel, this event underscores a deeper and more unsettling truth: climate change is reshaping our planet and our scientific methods in ways we are only beginning to understand.

It is a stark reminder that we are navigating uncharted waters. Just a year ago, the idea that a seiche could persist for nine days would have been dismissed as absurd. Similarly, a century ago, the notion that warming could destabilize slopes in the Arctic, leading to massive landslides and tsunamis happening almost yearly, would have been considered far-fetched. Yet, these once-unthinkable events are now becoming our new reality.

The “once unthinkable” ripples around the world.

As we move deeper into this new era, we can expect to witness more phenomena that defy our previous understanding, simply because our experience does not encompass the extreme conditions we are now encountering. We found a nine-day wave that previously no one could imagine could exist.

Traditionally, discussions about climate change have focused on us looking upwards and outwards to the atmosphere and to the oceans with shifting weather patterns, and rising sea levels. But Dickson Fjord forces us to look downward, to the very crust beneath our feet.

For perhaps the first time, climate change has triggered a seismic event with global implications. The landslide in Greenland sent vibrations through the Earth, shaking the planet and generating seismic waves that traveled all around the globe within an hour of the event. No piece of ground beneath our feet was immune to these vibrations, metaphorically opening up fissures in our understanding of these events.

This will happen again

Although landslide-tsunamis have been recorded before, the one in September 2023 was the first ever seen in east Greenland, an area that had appeared immune to these catastrophic climate change induced events.

This certainly won’t be the last such landslide-megatsunami. As permafrost on steep slopes continues to warm and glaciers continue to thin, we can expect these events to happen more often and on an even bigger scale across the world’s polar and mountainous regions. Recently identified unstable slopes in west Greenland and in Alaska are clear examples of looming disasters.

Landslide-affected slopes around Barry Arm fjord, Alaska. If the slopes suddenly collapse, scientists fear a large tsunami would hit the town of Whittier, 48km away.

Enlarge / Landslide-affected slopes around Barry Arm fjord, Alaska. If the slopes suddenly collapse, scientists fear a large tsunami would hit the town of Whittier, 48km away.

Gabe Wolken/USGS

As we confront these extreme and unexpected events, it is becoming clear that our existing scientific methods and toolkits may need to be fully equipped to deal with them. We had no standard workflow to analyze the 2023 Greenland event. We also must adopt a new mindset because our current understanding is shaped by a now near-extinct, previously stable climate.

As we continue to alter our planet’s climate, we must be prepared for unexpected phenomena that challenge our current understanding and demand new ways of thinking. The ground beneath us is shaking, both literally and figuratively. While the scientific community must adapt and pave the way for informed decisions, it’s up to decision-makers to act.

The authors discuss their findings in more depth.

Stephen Hicks is a Research Fellow in Computational Seismology, UCL and Kristian Svennevig is a Senior Researcher, Department of Mapping and Mineral Resources, Geological Survey of Denmark and Greenland

This article is republished from The Conversation under a Creative Commons license. Read the original article.

Bizarre, nine-day seismic signal caused by epic landslide in Greenland Read More »

seismic-data-shows-mars-is-often-pummeled-by-planet-shaking-meteorites

Seismic data shows Mars is often pummeled by planet-shaking meteorites

Brace for impact —

Seismic information now allows us to make a planet-wide estimate of impact rates.

One of the craters identified seismically, then confirmed through orbital images.

Enlarge / One of the craters identified seismically, then confirmed through orbital images.

Mars trembles with marsquakes, but not all of them are driven by phenomena that occur beneath the surface—many are the aftermath of meteorite strikes.

Meteorites crash down to Mars every day. After analyzing data from NASA’s InSight lander, an international team of researchers noticed that its seismometer, SEIS, detected six nearby seismic events. These were linked to the same acoustic atmospheric signal that meteorites generate when whizzing through the atmosphere of Mars. Further investigation identified all six as part of an entirely new class of quakes known as VF (very high frequency) events.

The collisions that generate VF marsquakes occur in fractions of a second, much less time than the few seconds it takes tectonic processes to cause quakes similar in size. This is some of the key seismological data that has helped us understand the occurrence of earthquakes caused by meteoric impacts on Mars. This is also the first time seismic data was used to determine how frequently impact craters are formed.

“Although a non-impact origin cannot be definitively excluded for each VF event, we show that the VF class as a whole is plausibly caused by meteorite impacts,” the researchers said in a study recently published in Nature.

Seismic shift

Scientists had typically determined the approximate meteorite impact rate on Mars by comparing the frequency of craters on its surface to the expected rate of impacts calculated using counts of lunar craters that were left behind by meteorites. Models of the lunar cratering rate were then adjusted to fit Martian conditions.

Looking to the Moon as a basis for comparison was not ideal, as Mars is especially prone to being hit by meteorites. The red planet is not only a more massive body that has greater gravitational pull, but it is located near the asteroid belt.

Another issue is that lunar craters are often better preserved than Martian craters because there is no place in the Solar System dustier than Mars. Craters in orbital images are often partly obscured by dust, which makes them difficult to identify. Sandstorms can complicate matters by covering craters in more dust and debris (something that cannot occur on the Moon due to the absence of wind).

InSight deployed its SEIS instrument after it landed in the Elysium Planitia region of Mars. In addition to detecting tectonic activity, the seismometer can potentially determine the impact rate through seismic data. When meteorites strike Mars, they produce seismic waves just like tectonic marsquakes do, and the waves can be detected by seismometers when they travel through the mantle and crust. An immense quake picked up by SEIS was linked to a crater 150 meters (492 feet) wide. SEIS would later detect five more marsquakes that were all associated with an acoustic signal (detected by a different sensor on InSight) that is a telltale sign of a falling meteorite.

A huge impact

Something else stood out about the six impact-driven marsquakes detected with seismic data. Because of the velocity of meteorites (over 3,000 meters or 9,842 feet per second), these events happened faster than any other type of marsquake, even faster than quakes in the high frequency (HF) class. That’s how they earned their own classification: very high frequency, or VF, quakes. When the InSight team used the Mars Reconnaissance Orbiter’s (MRO) Context Camera (CTX) to image the locations of the events picked up by SEIS, there were new craters present in the images.

There are additional seismic events that haven’t been assigned to craters yet. They are thought to be small craters formed by meteorites about the size of basketballs, which are extremely difficult to see in orbital images from MRO.

The researchers were able to use SEIS data to estimate the diameters of craters based on distance from InSight (according to how long it took seismic waves to reach the spacecraft) and the magnitude of the VF marsquakes associated with them. They were also able to derive the frequency of quakes picked up by SEIS. Once a frequency estimate based on the data was applied to the entire surface area of Mars, they estimated that around 280 to 360 VF quakes occur each year.

“The case is strong that the unique VF marsquake class is consistent with impacts,” they said in the same study. “It is, therefore, worthwhile considering the implications of attributing all VF events to meteoroid impacts.”

Their detection has added to the estimated number of impact craters on Mars since many could not be seen from space before. What can VF impacts tell us? The impact rate on a planet or moon is important for determining the age of that object’s surface. Using impacts has helped us determine that the surface of Venus is constantly being renewed by volcanic activity, while most of the surface of Mars has not been covered in lava for billions of years.

Figuring out the rate of meteorite impacts can also help protect spacecraft and, someday, maybe Martian astronauts, from potential hazards. The study suggests that there are periods where impacts are more or less frequent, so it might be possible to predict when the sky is a bit more likely to be clear of falling space rocks—and when it isn’t. Meteorites are not much of a danger to Earth since most of them burn up in the atmosphere. Mars has a much thinner atmosphere that more can make it through, and there is no umbrella for a meteor shower.

Nature Astronomy, 2024. DOI: 10.1038/s41550-024-02301-z

Seismic data shows Mars is often pummeled by planet-shaking meteorites Read More »

the-struggle-to-understand-why-earthquakes-happen-in-america’s-heartland

The struggle to understand why earthquakes happen in America’s heartland

Top: A view of the downtown Memphis skyline, including the Hernando De Soto bridge which has been retrofitted for earthquakes. Memphis is located around 40 miles from a fault line in the quake-prone New Madrid system.

Enlarge / Top: A view of the downtown Memphis skyline, including the Hernando De Soto bridge which has been retrofitted for earthquakes. Memphis is located around 40 miles from a fault line in the quake-prone New Madrid system.

iStock via Getty Images

The first earthquake struck while the town was still asleep. Around 2: 00 am on Dec. 16, 1811, New Madrid—a small frontier settlement of 400 people on land now located in Missouri—was jolted awake. Panicked townsfolk fled their homes as buildings collapsed and the smell of sulfur filled the air.

The episode didn’t last long. But the worst was yet to come. Nearly two months later, after dozens of aftershocks and another massive quake, the fault line running directly under the town ruptured. Thirty-one-year-old resident Eliza Bryan watched in horror as the Mississippi River receded and swept away boats full of people. In nearby fields, geysers of sand erupted, and a rumble filled the air.

In the end, the town had dropped at least 15 feet. Bryan and others spent a year and a half living in makeshift camps while they waited for the aftershocks to end. Four years later, the shocks had become less common. At last, the rattled townspeople began “to hope that ere long they will entirely cease,” Bryan wrote in a letter.

Whether Bryan’s hope will stand the test of time is an open question.

The US Geological Survey released a report in December 2023 detailing the risk of dangerous earthquakes around the country. As expected on the hazard map, deep red risk lines run through California and Alaska. But the map also sports a big bull’s eye in the middle of the country—right over New Madrid.

The USGS estimates that the region has a 25 to 40 percent chance of a magnitude 6.0 or higher earthquake in the next 50 years, and as much as a 10 percent chance of a repeat of the 1811-1812 sequence. While the risk is much lower compared to, say, California, experts say that when it comes to earthquake resistance, the New Madrid region suffers from inadequate building codes and infrastructure.

Caught in this seismic splash zone are millions of people living across five states—mostly in Tennessee and Missouri, as well as Kentucky, Illinois, and Arkansas—including two major cities, Memphis and St. Louis. Mississippi, Alabama, and Indiana have also been noted as places of concern.

In response to the potential for calamity, geologists have learned a lot about this odd earthquake hotspot over the last few decades. Yet one mystery has persisted: why earthquakes even happen here in the first place.

This is a problem, experts say. Without a clear mechanism for why New Madrid experiences earthquakes, scientists are still struggling to answer some of the most basic questions, like when—or even if—another large earthquake will strike the region. In Missouri today, earthquakes are “not as front of mind” as other natural disasters, said Jeff Briggs, earthquake program manager for the Missouri State Emergency Management Agency.

But when the next big shake comes, “it’s going to be the biggest natural disaster this state has ever experienced.”

The struggle to understand why earthquakes happen in America’s heartland Read More »

taylor-swift-fans-dancing-and-jumping-created-last-year’s-“swift-quakes”

Taylor Swift fans dancing and jumping created last year’s “Swift quakes”

Good vibrations —

“Shake It Off” produced tremors equivalent to a local magnitude earthquake of 0.851.

Taylor Swift on the Eras Tour in 2023

Enlarge / Taylor Swift during her Eras Tour. Crowd motions likely caused mini “Swift quakes” recorded by seismic monitoring stations.

When mega pop star Taylor Swift gave a series of concerts last August at the SoFi Stadium in Los Angeles, regional seismic network stations recorded unique harmonic vibrations known as “concert tremor.” A similar “Swift quake” had occurred the month before in Seattle, prompting scientists from the California Institute of Technology and UCLA to take a closer look at seismic data collected during Swift’s LA concert.

The researchers concluded that the vibrations were largely generated by crowd motion as “Swifties” jumped and danced enthusiastically to the music and described their findings in a new paper published in the journal Seismological Research Letters. The authors contend that gaining a better understanding of atypical seismic signals like those generated by the Swift concert could improve the analysis of seismic signals in the future, as well as bolster emerging applications like using signals from train noise for seismic interferometry.

Concert tremor consists of low-frequency signals of extended duration with harmonic frequency peaks between 1 and 10 Hz, similar to the signals generated by volcanoes or trains. There has been considerable debate about the source of these low-frequency concert tremor signals: Are they produced by the synchronized movement of the crowd, or by the sound systems or instruments coupled to the stage? Several prior studies of stadium concerts have argued for the former hypothesis, while a 2015 study found that a chanting crowd at a football game produced similar harmonic seismic tremors. However, a 2008 study concluded that such signals generated during an outdoor electronic dance music festival came from the sound system vibrating to the musical beat.

The Caltech/UCLA team didn’t just rely on the data from the regional network stations. The scientists placed additional motion sensors throughout the stadium prior to the concert, enabling them to characterize all the seismic signals produced during the concert. The signals had such unique characteristics that it was relatively easy to identify them with a spectrogram. In fact, the authors were able to identify 43 of the 45 songs Swift performed based on the distinctive signal of each song.

They also calculated how much radiated energy was produced by each song. “Shake It Off” produced the most radiated energy, equivalent to a local magnitude earthquake of 0.851. “Keep in mind this energy was released over a few minutes compared to a second for an earthquake of that size,” said co-author Gabrielle Tepp of Caltech.

Tepp is a volcanologist and musician in her own right. That combination came in handy when it was time to conduct a lab-based experiment to test the team’s source hypothesis using a portable public announcement speaker system. They played Swift’s “Love Story” and Tepp gamely danced and jumped with the beat during the last chorus while sensors recorded the seismic vibrations. “Even though I was not great at staying in the same place—I ended up jumping around in a small circle, like at a concert—I was surprised at how clear the signal came out,” said Tepp. They also tested a steady beat as Tepp played her bass guitar in order to isolate the signal from a single instrument.

The resulting fundamental harmonic during the jumping was consistent with the song’s beat rate. However, the bass beats didn’t produce a harmonic signal, which was surprising since those beats were better synchronized with the actual musical beats than Tepp’s jumping motions. This might be due to the rounder shape of the bass beat signals compared to sharper spiking signals in response to the jumping.

Map showing the concert venue and nearby seismic stations (circles) that recorded signals from the Swift concerts (blue).

Enlarge / Map showing the concert venue and nearby seismic stations (circles) that recorded signals from the Swift concerts (blue).

Gabrielle Tepp et al., 2024

The authors noted that their experiment did not involve a stage or stadium-grade sound system, “so we cannot completely rule out loudspeakers as a vibrational energy source,” they wrote. Nonetheless, “Overall the evidence suggests that crowd movement is the primary source of the low-frequency signals, with the speaker system or instruments potentially contributing via stage of building vibrations.” The fact that the same kind of low-frequency seismic signals were not detected during pre-concert sound checks seems to support that conclusion, although there were higher frequency signals during sound checks.

The team also studied the structural response of the stadium and conducted a similar analysis of seismic readings from three other concerts at SoFi Stadium that summer: country music’s Morgan Waller, Beyoncé, and Metallica, as well as picking up clear signals at one monitoring station for the three opening acts: Pantera, DJ Khaled, and Five Finger Death Punch, respectively. The results were markedly similar to the seismic data gathered from the Taylor Swift concerts, although none of the signals matched the strongest of those detected during the Swift concerts.

The researchers were surprised to find that the seismic signals from the Metallica concert were the weakest among all the concerts and markedly different from the others, “slanted and kind of weird looking,” per Tepp. They found several comments in music forums from fans complaining about poor sound quality at the Metallica concert. “If fans had a hard time discerning the song or beat, it may explain the more variable signals because it would have influenced their movements,” the authors wrote.

It’s also possible that heavy metal live performances are less tightly choreographed than Beyoncé or Swift performances, or that heavy metal fans don’t move with the music in quite the same way. “Metal fans like to headbang a lot, so they’re not necessarily bouncing,” said Tepp. “It might just be that the ways in which they move don’t create as strong of a signal.”

Seismological Research Letters, 2024. DOI: 10.1785/0220230385  (About DOIs).

Taylor Swift fans dancing and jumping created last year’s “Swift quakes” Read More »