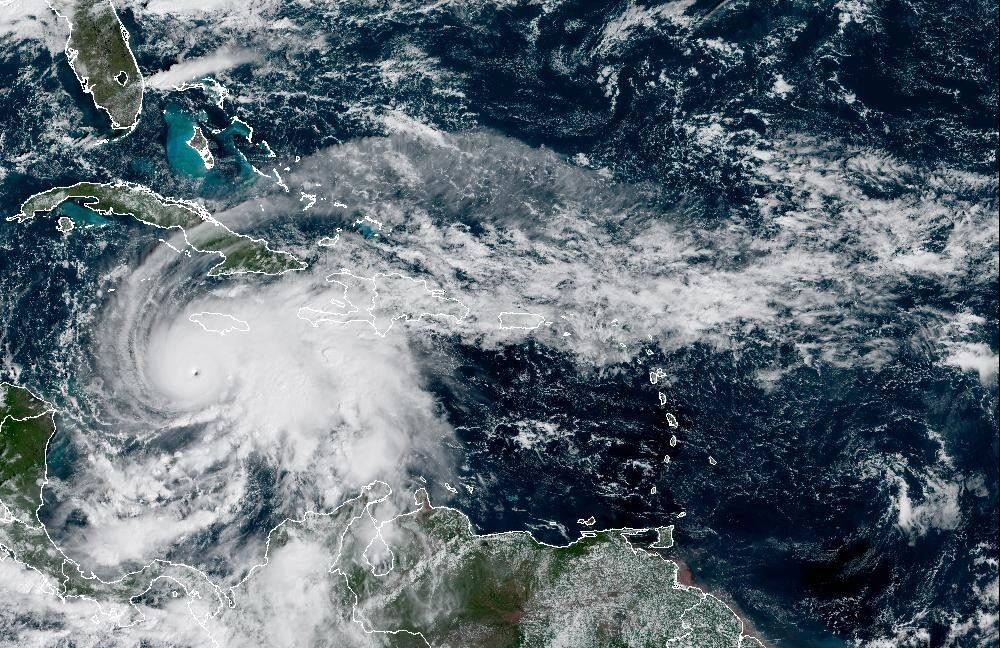
The sole bright spot is that, as of Monday, the core of the storm’s strongest winds remains fairly small. Based on recent data, its hurricane-force winds only extend about 25 miles from the center. Unfortunately, Melissa will make a direct hit on Jamaica, with the island’s capital city of Kingston to the right of the center, where winds and surge will be greatest.
Beyond Jamaica, Melissa will likely be one of the strongest hurricanes on record to hit Cuba. Melissa will impact the eastern half of the island on Tuesday night, bringing the trifecta of heavy rainfall, damaging winds, and storm surge. The storm also poses lesser threats to Hispaniola, the Bahamas, and potentially Bermuda down the line. There will be no impacts in the United States.
A sneakily strong season
Most US coastal residents will consider this Atlantic season, which officially ends in a little more than a month, to be fairly quiet. There have been relatively few direct impacts to the United States from named storms.
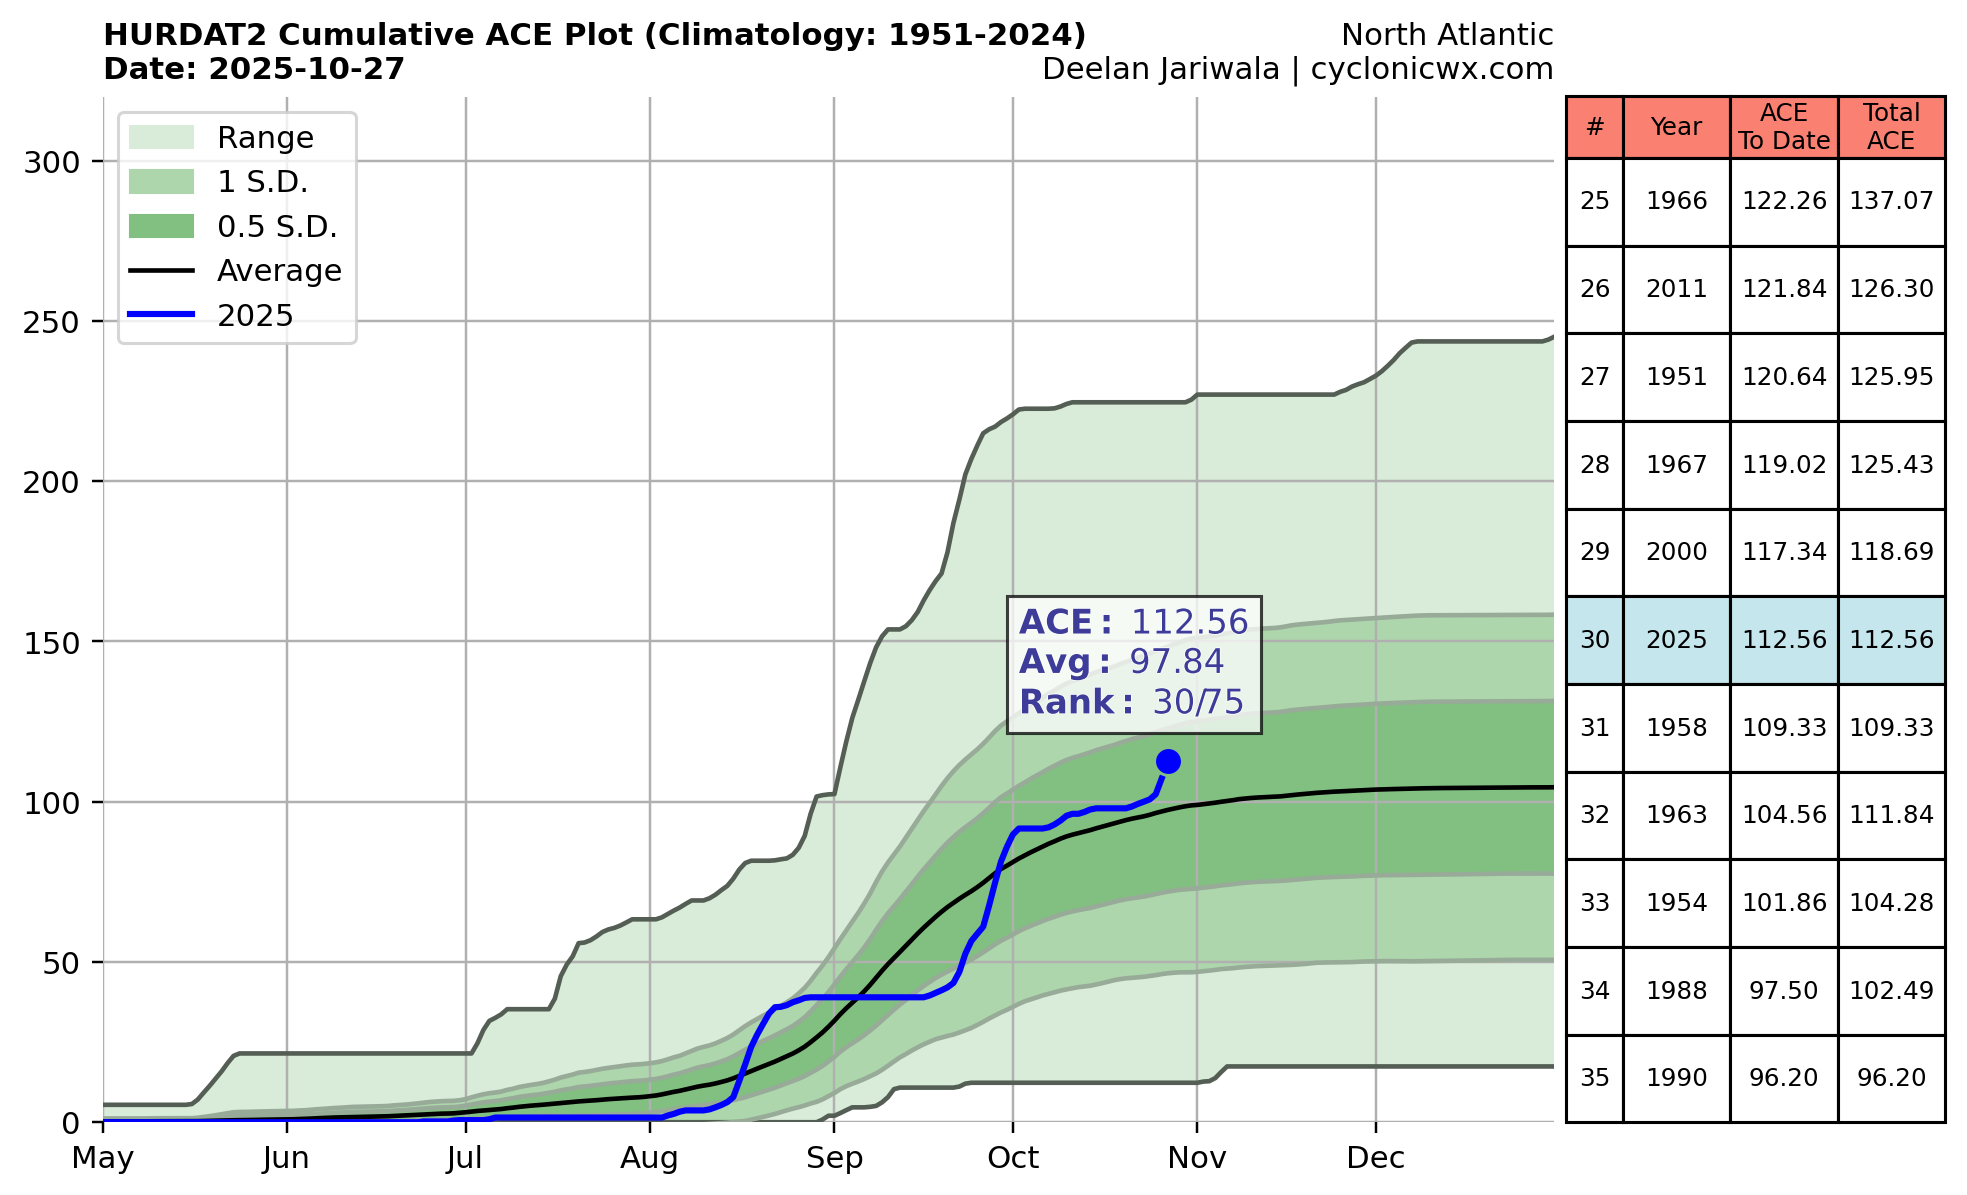
One can see the signatures of Erin, Humberto, and Melissa in this chart of Accumulated Cyclone Energy for 2025.
Credit: CyclonicWx.com
One can see the signatures of Erin, Humberto, and Melissa in this chart of Accumulated Cyclone Energy for 2025. Credit: CyclonicWx.com
But this season has been sneakily strong. Melissa is just the 45th storm since 1851 to reach Category 5 status, as defined as having sustained winds of 157 mph or greater. Already this year, Erin and Humberto reached Category 5 status, and now Melissa is the third such hurricane. Fortunately, the former two storms posed minimal threat to land.
Before this year, there had only ever been one season with three Category 5 hurricanes on record: 2005, which featured three storms that all impacted US Gulf states and had their names retired, Katrina, Rita, and Wilma.
Most of the time, not a big deal. But in critical times, the losses will be felt.
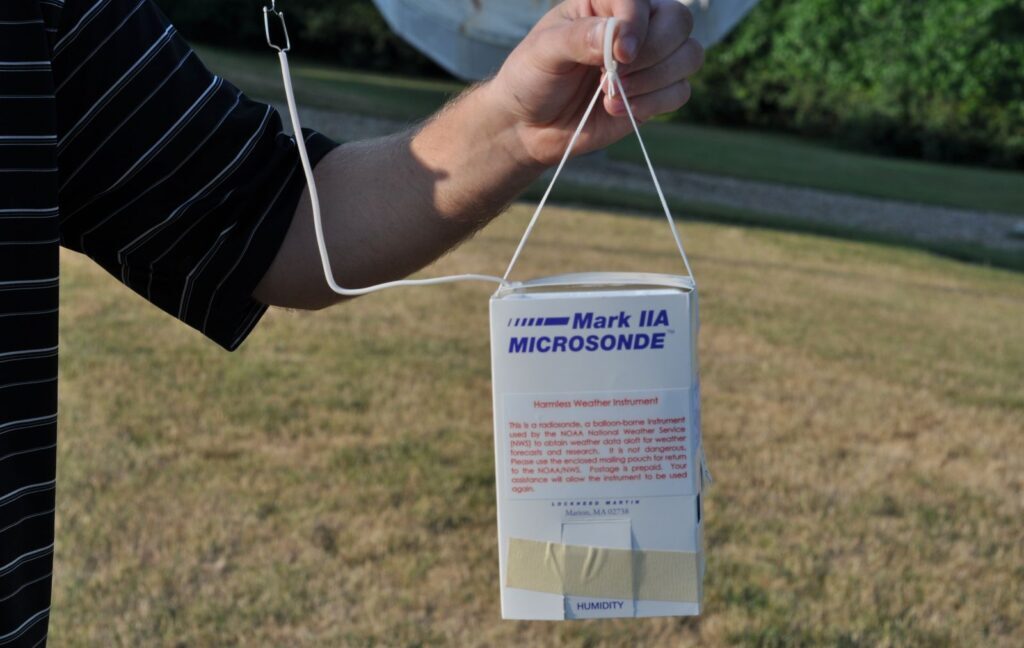
A radiosonde with mailing instructions. Credit: NWS Pittsburgh
Due to staff reductions, retirements, and a federal hiring freeze, the National Weather Service has announced a series of suspensions involving weather balloon launches in recent weeks. The question is, will this significantly degrade forecasts in the United States and around the world?
On February 27, it was announced that balloon launches would be suspended entirely at Kotzebue, Alaska, due to staffing shortages. In early March, Albany, N.Y., and Gray, Maine, announced periodic disruptions in launches. Since March 7, it appears that Gray has not missed any balloon launches through Saturday. Albany, however, has missed 14 of them, all during the morning launch cycle (12z).
The kicker came on Thursday afternoon when it was announced that all balloon launches would be suspended in Omaha, Neb., and Rapid City, S.D., due to staffing shortages. Additionally, the balloon launches in Aberdeen, S.D.; Grand Junction, Colo.; Green Bay, Wis.; Gaylord, Mich.; North Platte, Neb.; and Riverton, Wyo., would be reduced to once a day from twice a day.
What are weather balloons?
In a normal time, weather balloons would be launched across the country and world twice per day, right at about 8 am ET and 8 pm ET (one hour earlier in winter), or what we call 12z and 00z. That’s Zulu time, or noon and midnight in Greenwich, England. Rather than explain the whole reasoning behind why we use Zulu time in meteorology, here’s a primer on everything you need to know. Weather balloons are launched around the world at the same time. It’s a unique collaboration and example of global cooperation in the sciences, something that has endured for many years.
These weather balloons are loaded up with hydrogen or helium, soar into the sky, up to and beyond jet stream level, getting to a height of over 100,000 feet before they pop. Attached to the weather balloon is a tool known as a radiosonde, or “sonde” for short. This is basically a weather-sensing device that measures all sorts of weather variables like temperature, dewpoint, pressure, and more. Wind speed is usually derived from this based on GPS transmitting from the sonde.
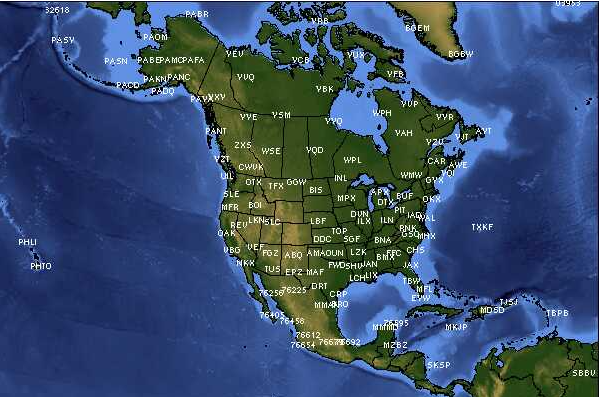
Sunday morning’s upper air launch map showing a gaping hole over the Rockies and some of the Plains.
Credit: University of Wyoming
Sunday morning’s upper air launch map showing a gaping hole over the Rockies and some of the Plains. Credit: University of Wyoming
What goes up must come down, so when the balloon pops, that radiosonde falls from the sky. A parachute is attached to it, slowing its descent and ensuring no one gets plunked on the head by one. If you find a radiosonde, it should be clearly marked, and you can keep it, let the NWS know you found it, or dispose of it properly. In some instances, there may still be a way to mail it back to the NWS (postage and envelope included and prepaid).
How this data is used
In order to run a weather model, you need an accurate snapshot of what we call the initial conditions. What is the weather at time = zero? That’s your initialization point. Not coincidentally, weather models are almost always run at 12z and 00z, to time in line with retrieving the data from these weather balloons. It’s a critically important input to almost all weather modeling we use.
The data from balloon launches can be plotted on a chart called a sounding, which gives meteorologists a vertical profile of the atmosphere at a point. During severe weather season, we use these observations to understand the environment we are in, assess risks to model output, and make changes to our own forecasts. During winter, these observations are critical to knowing if a storm will produce snow, sleet, or freezing rain.
Observations from soundings are important inputs for assessing turbulence that may impact air travel, marine weather, fire weather, and air pollution. Other than some tools on some aircraft that we utilize, the data from balloon launches is the only real good verification tool we have for understanding how the upper atmosphere is behaving.
Have we lost weather balloon data before?
We typically lose out on a data point or two each day for various reasons when the balloons are launched. We’ve also been operating without a weather balloon launch in Chatham, Mass., for a few years because coastal erosion made the site too challenging and unsafe.
Tallahassee, Fla., has been pausing balloon launches for almost a year now due to a helium shortage and inability to safely switch to hydrogen gas for launching the balloons. In Denver, balloon launches have been paused since 2022 due to the helium shortage as well.
Those are three sites, though, spread out across the country. We are doubling or tripling the number of sites without launches now, many in critical areas upstream of significant weather.
Can satellites replace weather balloons?
Yes and no.
On one hand, satellites today are capable of incredible observations that can rival weather balloons at times. And they also cover the globe constantly, which is important. That being said, satellites cannot completely replace balloon launches. Why? Because the radiosonde data those balloon launches give us basically acts as a verification metric for models in a way that satellites cannot. It also helps calibrate derived satellite data to ensure that what the satellite is seeing is recorded correctly.
But in general, satellites cannot yet replace weather balloons. They merely act to improve upon what weather balloons do. A study done in the middle part of the last decade found that wind observations improved rainfall forecasts by 30 percent. The one tool at that time that made the biggest difference in improving the forecast were radiosondes. Has this changed since then? Yes, almost certainly. Our satellites have better resolution, are capable of getting more data, and send data back more frequently. So certainly, it’s improved some. But enough? That’s unclear.
An analysis done more recently on the value of dropsondes (the opposite of balloon launches; this time, the sensor is dropped from an aircraft instead of launched from the ground) in forecasting West Coast atmospheric rivers showed a marked improvement in forecasts when those targeted drops occur. Another study in 2017 showed that aircraft observations actually did a good job filling gaps in the upper air data network.
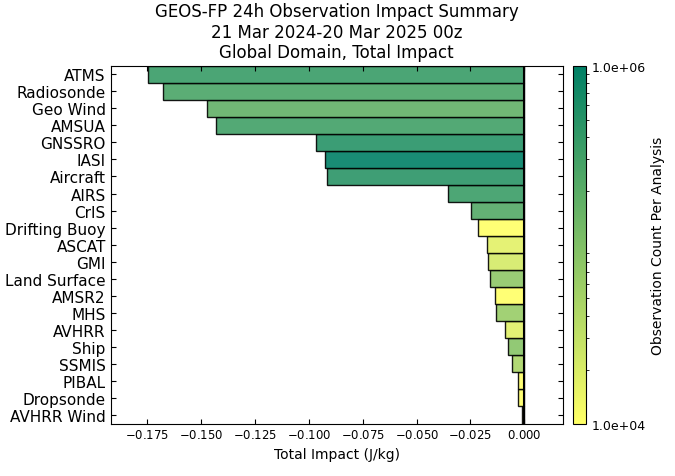
But to be quite honest, there have not been many studies that I can find in recent years that assess how the new breed of satellites has (or has not) changed the value of upper-air observations. The NASA GEOS model keeps a record of what data sources are of most impact to model verification with respect to 24-hour forecasts. Number two on the list? Radiosondes. This could be considered probably a loose comp to the GFS model, one of the major weather models used by meteorologists globally.
The verdict
In reality, the verdict in all this is to be determined, particularly statistically. Will it make a meaningful statistical difference in model accuracy? Over time, yes, probably, but not in ways that most people will notice day to day.
However, based on 20 years of experience and a number of conversations about this with others in the field, there are some very real, very serious concerns beyond statistics. One thing is that the suspended weather balloon launches are occurring in relatively important areas for weather impacts downstream. A missed weather balloon launch in Omaha or Albany won’t impact the forecast in California. But what if a hurricane is coming? What if a severe weather event is coming? You’ll definitely see impacts to forecast quality during major, impactful events. At the very least, these launch suspensions will increase the noise-to-signal ratio with respect to forecasts.
The element with the second-highest impact on the NASA GEOS model? Radiosondes.
Credit: NASA
The element with the second-highest impact on the NASA GEOS model? Radiosondes. Credit: NASA
In other words, there may be situations where you have a severe weather event expected to kickstart in one place, but the lack of knowing the precise location of an upper air disturbance in the Rockies thanks to a suspended launch from Grand Junction, Colo., will lead to those storms forming 50 miles farther east than expected. In other words, losing this data increases the risk profile for more people in terms of knowing about weather, particularly high-impact weather.
Let’s say we have a hurricane in the Gulf that is rapidly intensifying, and we are expecting it to turn north and northeast thanks to a strong upper-air disturbance coming out of the Rockies, leading to landfall on the Alabama coast. What if the lack of upper-air observations has led to that disturbance being misplaced by 75 miles. Now, instead of Alabama, the storm is heading toward New Orleans. Is this an extreme example? Honestly, I don’t think it is as extreme as you might think. We often have timing and amplitude forecast issues with upper-air disturbances during hurricane season, and the reality is that we may have to make some more frequent last-second adjustments now that we didn’t have to in recent years. As a Gulf Coast resident, this is very concerning.
I don’t want to overstate things. Weather forecasts aren’t going to dramatically degrade day to day because we’ve reduced some balloon launches across the country. They will degrade, but the general public probably won’t notice much difference 90 percent of the time. But that 10 percent of the time? It’s not that the differences will be gigantic. But the impact of those differences could very well be gigantic, put more people in harm’s way, and increase the risk profile for an awful lot of people. That’s what this does: It increases the risk profile, it will lead to reduced weather forecast skill scores, and it may lead to an event that surprises a portion of the population that isn’t used to be surprised in the 2020s. To me, that makes the value of weather balloons very, very significant, and I find these cuts to be extremely troubling.
Should further cuts in staffing lead to further suspensions in weather balloon launches, we will see this problem magnify more often and involve bigger misses. In other words, the impacts here may not be linear, and repeated increased loss of real-world observational data will lead to very significant degradation in weather model performance that may be noticed more often than described above.
The Eyewall is dedicated to covering tropical activity in the Atlantic Ocean, Caribbean Sea, and Gulf of Mexico. The site was founded in June 2023 by Matt Lanza and Eric Berger, who work together on the Houston-based forecasting site Space City Weather.
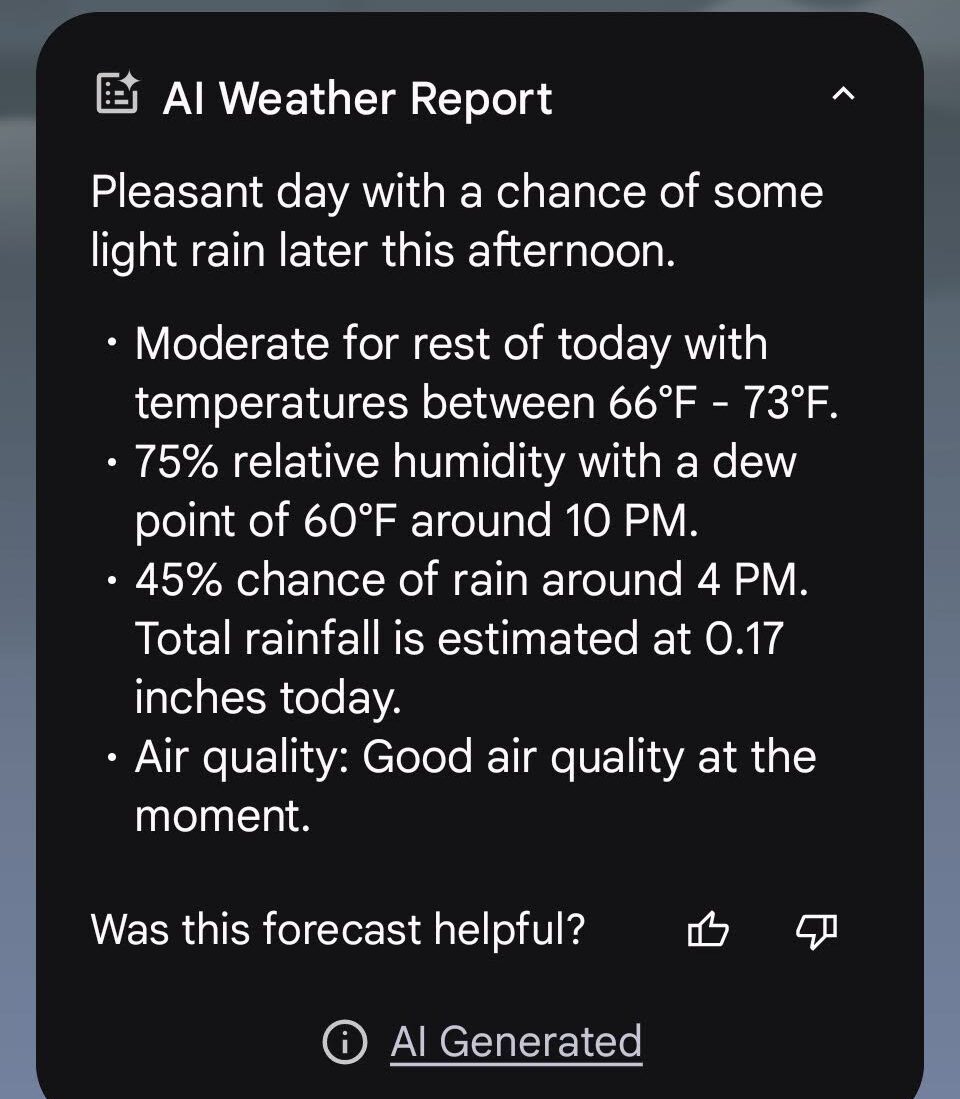
There’s a prominent “AI generated weather report” on top of the weather stack, which is a combination of summary and familiarity. “Cold and rainy day, bring your umbrella and hold onto your hat!” is Google’s example; I can’t provide another one, because an update to “Gemini Nano” is pending.
Credit: Kevin Purdy
You can see weather radar for your location, along with forecasted precipitation movement. The app offers “Nowcasting” precipitation guesses, like “Rain continuing for 2 hours” or “Light rain in 10 minutes.”
Credit: Kevin Purdy
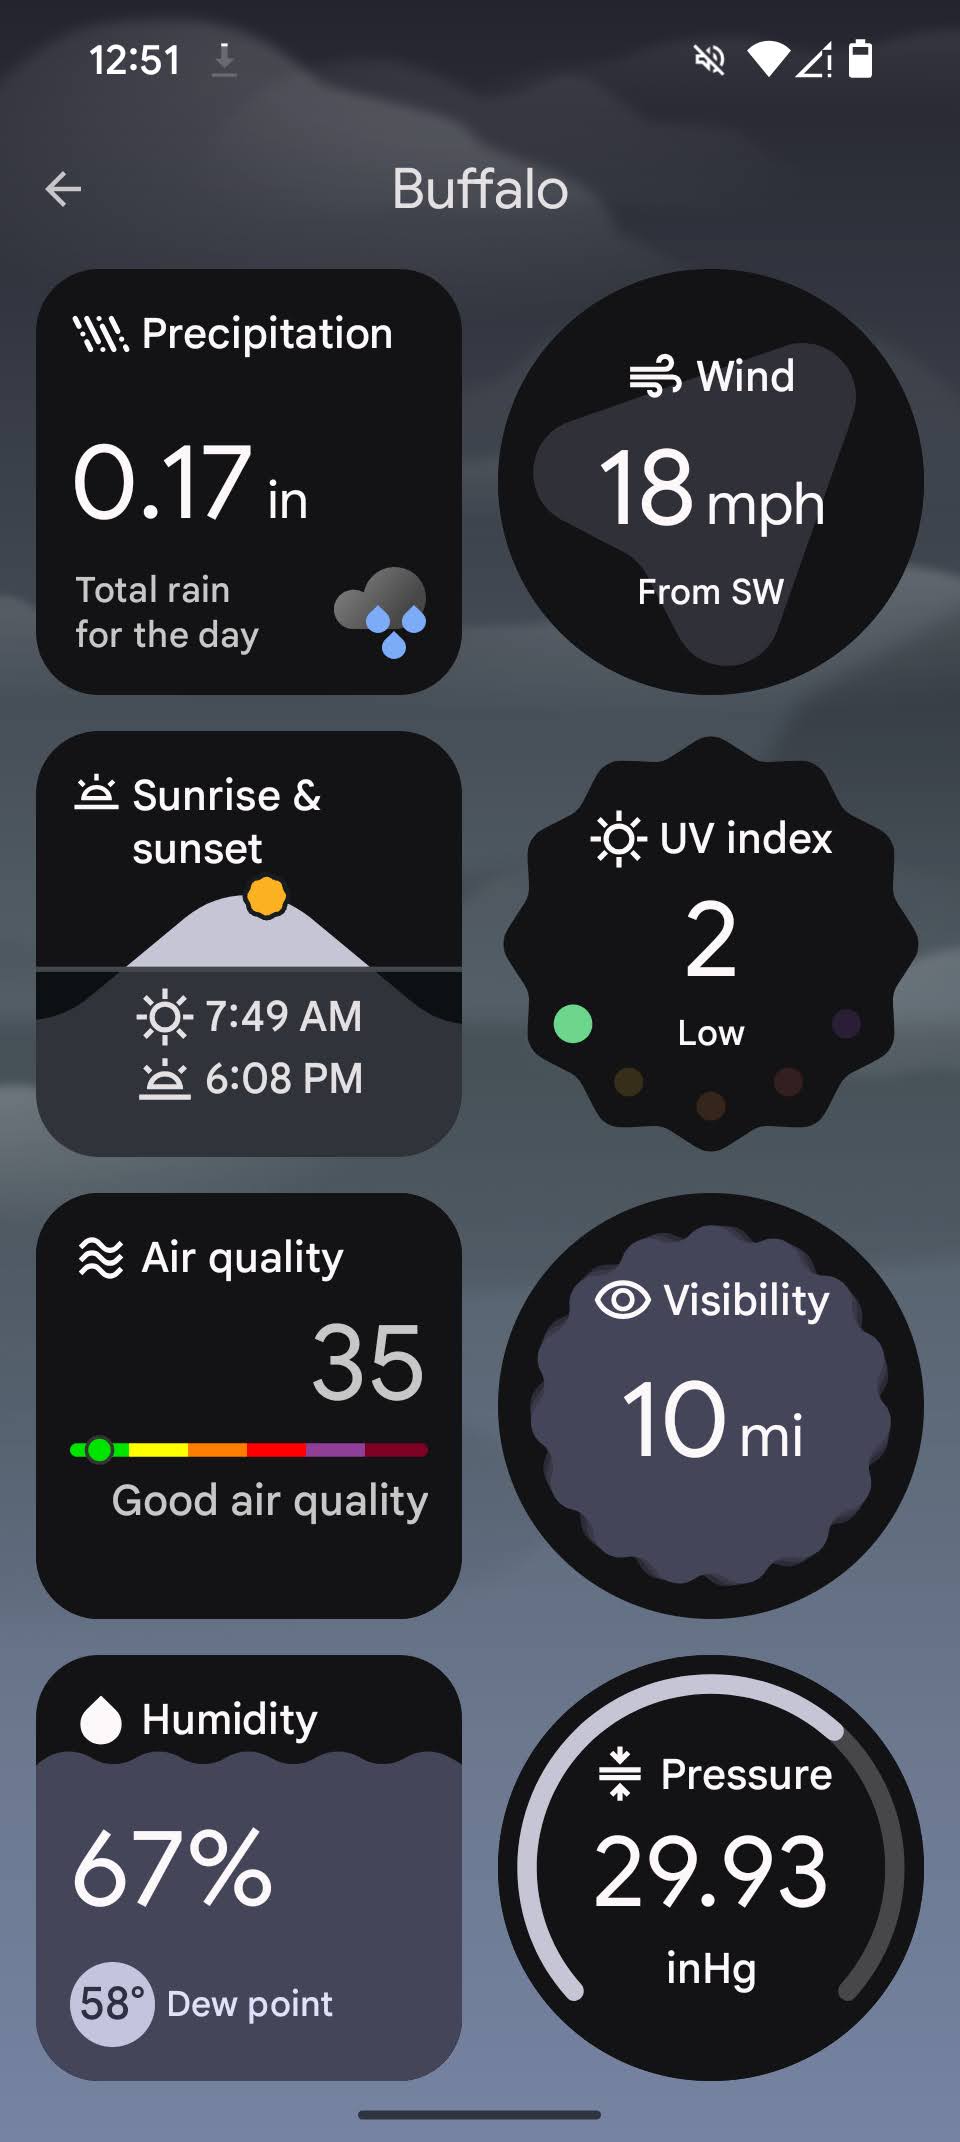
The best feature, one seen on the version of Weather that shipped to the Pixel Tablet and Fold, is that you can rearrange the order of data shown on your weather screen. I moved the UV index, humidity, sunrise/sunset, and wind conditions as high as they could go on my setup. It’s a trade-off, because the Weather app’s data widgets are so big as to require scrolling to get the full picture of a day, and you can’t move the AI summary or 10-day forecast off the top. But if you only need a few numbers and like a verbal summary, it’s handy.
Sadly, if you’re an allergy sufferer and you’re not in the UK, Germany, France, or Italy, Google can’t offer you any pollen data or forecasts. There is also, I am sad to say, no frog.
Google’s Weather app isn’t faring so well with Play Store reviewers. Users are miffed that they can’t see a location’s weather without adding it to their saved locations list; that other Google apps, including the “At a Glance” app on every Pixel’s default launcher, send you to the Google app’s summary instead of this app; the look of the weather map; and, most of all, that it does not show up in some phones’ app list, but only as a widget.
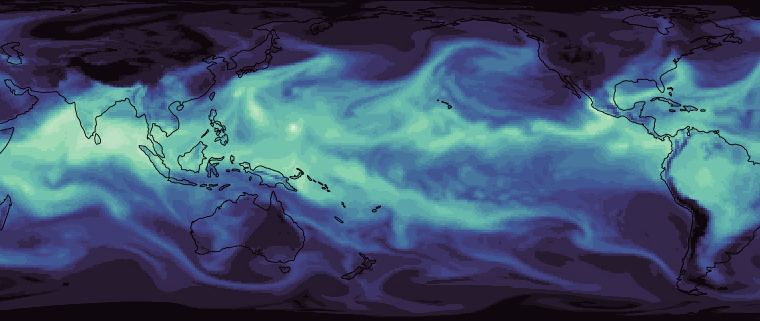
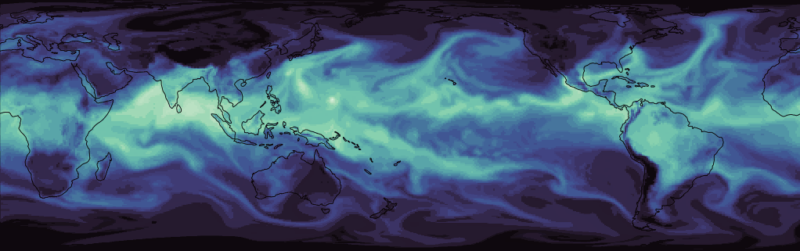
Enlarge/ Image of some of the atmospheric circulation seen during NeuralGCM runs.
Google
Right now, the world’s best weather forecast model is a General Circulation Model, or GCM, put together by the European Center for Medium-Range Weather Forecasts. A GCM is in part based on code that calculates the physics of various atmospheric processes that we understand well. For a lot of the rest, GCMs rely on what’s termed “parameterization,” which attempts to use empirically determined relationships to approximate what’s going on with processes where we don’t fully understand the physics.
Lately, GCMs have faced some competition from machine-learning techniques, which train AI systems to recognize patterns in meteorological data and use those to predict the conditions that will result over the next few days. Their forecasts, however, tend to get a bit vague after more than a few days and can’t deal with the sort of long-term factors that need to be considered when GCMs are used to study climate change.
On Monday, a team from Google’s AI group and the European Centre for Medium-Range Weather Forecasts are announcing NeuralGCM, a system that mixes physics-based atmospheric circulation with AI parameterization of other meteorological influences. Neural GCM is computationally efficient and performs very well in weather forecast benchmarks. Strikingly, it can also produce reasonable-looking output for runs that cover decades, potentially allowing it to address some climate-relevant questions. While it can’t handle a lot of what we use climate models for, there are some obvious routes for potential improvements.
Meet NeuralGCM
NeuralGCM is a two-part system. There’s what the researchers term a “dynamical core,” which handles the physics of large-scale atmospheric convection and takes into account basic physics like gravity and thermodynamics. Everything else is handled by the AI portion. “It’s everything that’s not in the equations of fluid dynamics,” said Google’s Stephan Hoyer. “So that means clouds, rainfall, solar radiation, drag across the surface of the Earth—also all the residual terms in the equations that happen below the grid scale of about roughly 100 kilometers or so.” It’s what you might call a monolithic AI. Rather than training individual modules that handle a single process, such as cloud formation, the AI portion is trained to deal with everything at once.
Critically, the whole system is trained concurrently rather than training the AI separately from the physics core. Initially, performance evaluations and updates to the neural network were performed at six-hour intervals since the system isn’t very stable until at least partially trained. Over time, those are stretched out to five days.
The result is a system that’s competitive with the best available for forecasts running out to 10 days, often exceeding the competition depending on the precise measure used (in addition to weather forecasting benchmarks, the researchers looked at features like tropical cyclones, atmospheric rivers, and the Intertropical Convergence Zone). On the longer forecasts, it tended to produce features that were less blurry than those made by pure AI forecasters, even though it was operating at a lower resolution than they were. This lower resolution means larger grid squares—the surface of the Earth is divided up into individual squares for computational purposes—than most other models, which cuts down significantly on its computing requirements.
Despite its success with weather, there were a couple of major caveats. One is that NeuralGCM tended to underestimate extreme events occurring in the tropics. The second is that it doesn’t actually model precipitation; instead, it calculates the balance between evaporation and precipitation.
But it also comes with some specific advantages over some other short-term forecast models, key among them being that it isn’t actually limited to running over the short term. The researchers let it run for up to two years, and it successfully reproduced a reasonable-looking seasonal cycle, including large-scale features of the atmospheric circulation. Other long-duration runs show that it can produce appropriate counts of tropical cyclones, which go on to follow trajectories that reflect patterns seen in the real world.

