NASA built a Moon rover but can’t afford to get it to the launch pad

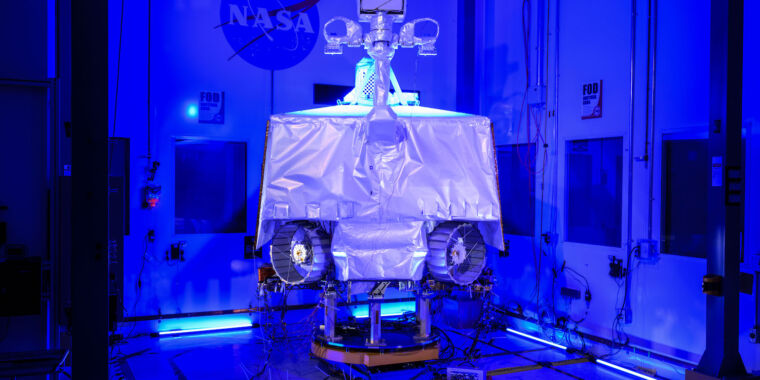
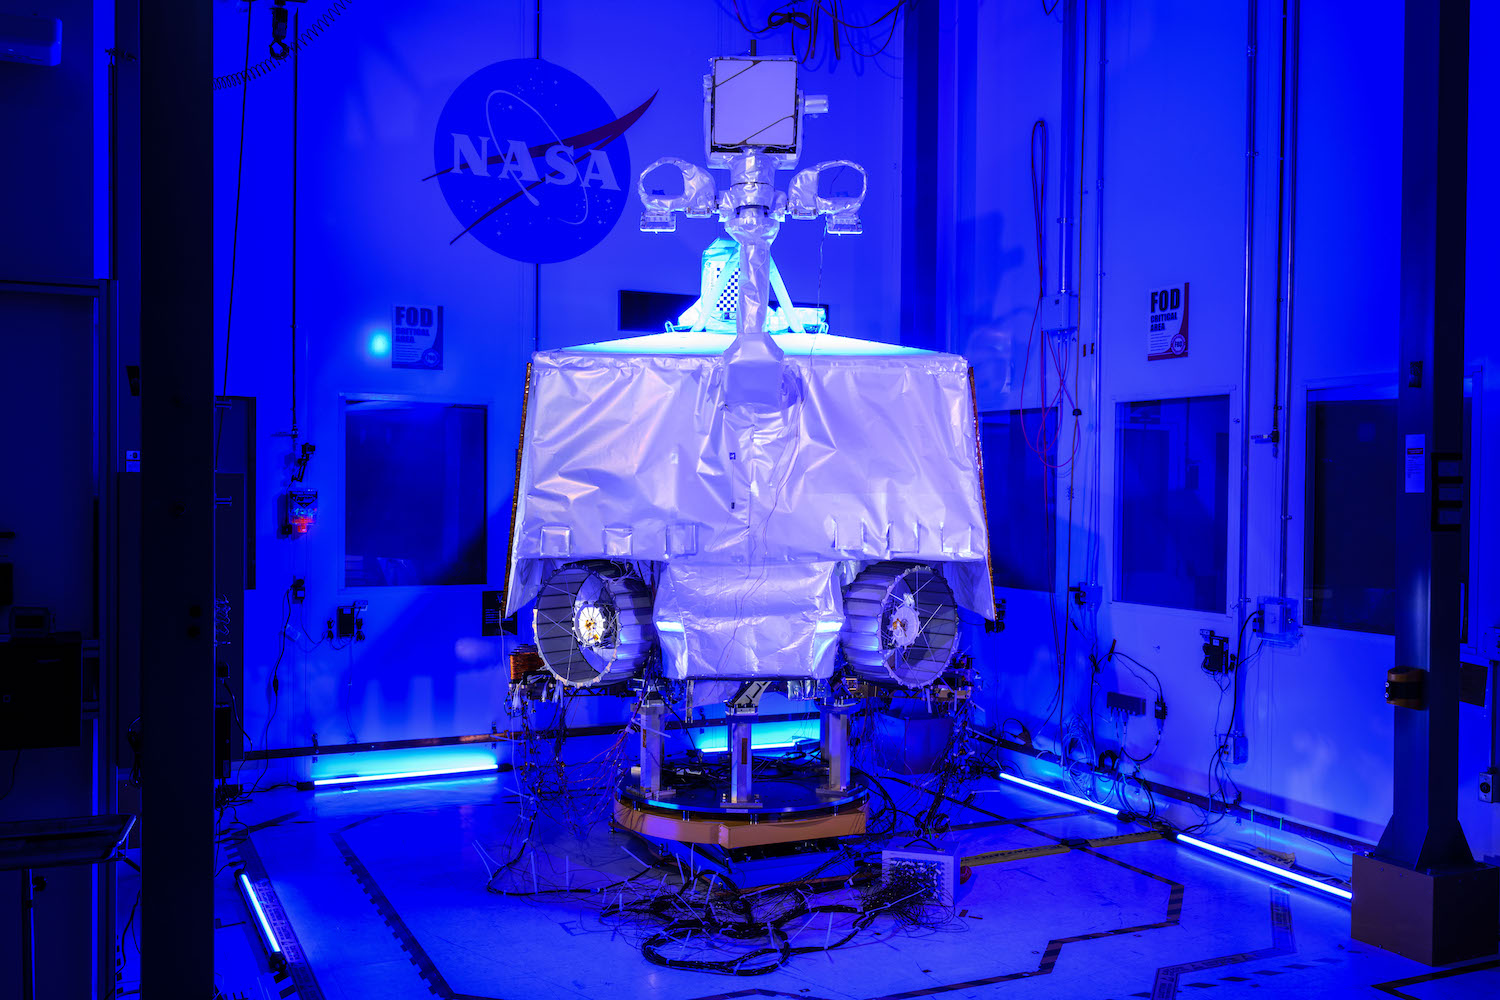
Enlarge / NASA completed assembling the VIPER rover last month at the Johnson Space Center in Houston.
NASA has spent $450 million designing and building a first-of-its-kind robot to drive into eternally dark craters at the Moon’s south pole, but the agency announced Wednesday it will cancel the rover due to delays and cost overruns.
“NASA intends to discontinue the VIPER mission,” said Nicky Fox, head of the agency’s science mission directorate. “Decisions like this are never easy, and we haven’t made this one, in any way, lightly. In this case, the projected remaining expenses for VIPER would have resulted in either having to cancel or disrupt many other missions in our Commercial Lunar Payload Services (CLPS) line.”
NASA has terminated science missions after development delays and cost overruns before, but it’s rare to cancel a mission with a spacecraft that is already built.
The Volatiles Investigating Polar Exploration Rover (VIPER) mission was supposed to be a robotic scout for NASA’s Artemis program, which aims to return astronauts to the lunar surface in the next few years. VIPER was originally planned to launch in late 2023 and was slated to fly to the Moon aboard a commercial lander provided by Pittsburgh-based Astrobotic, which won a contract from NASA in 2020 to deliver the VIPER rover to the lunar surface. Astrobotic is one of 14 companies in the pool of contractors for NASA’s CLPS program, with the goal of transporting government-sponsored science payloads to the Moon.
But VIPER has been delayed at least two years—the most recent schedule projected a launch in September 2025—causing its cost to grow from $433 million to more than $609 million. The ballooning costs automatically triggered a NASA review to determine whether to proceed with the mission or cancel it. Ultimately, officials said they determined NASA couldn’t pay the extra costs for VIPER without affecting other Moon missions.
“Therefore, we’ve made the decision to forego this particular mission, the VIPER mission, in order to be able to sustain the entire program,” Fox said.
“We’re disappointed,” said John Thornton, CEO of Astrobotic. “It’s certainly difficult news… VIPER has been a great team to work with, and we’re disappointed we won’t get the chance to fly them to the Moon.”
NASA said it will consider “expressions of interest” submitted by US industry and international partners by August 1 for use of the existing VIPER rover at no cost to the government. If NASA can’t find anyone to take over VIPER who can pay to get it to the Moon, the agency plans to disassemble the rover and harvest instruments and components for future lunar missions.
Scientists were dismayed by VIPER’s cancellation.
“It’s absurd, to be honest with you,” said Clive Neal, a planetary geologist at the University of Notre Dame. “It made no sense to me in terms of the economics. You’re canceling a mission that is complete, built, ready to go. It’s in the middle of testing.”
“This is a bad mistake,” wrote Phil Metzger, a planetary physicist at the University of Central Florida, in a post on X. “This was the premier mission to measure lateral and vertical variations of lunar ice in the soil. It would have been revolutionary. Other missions don’t replace what is lost here.”
Built with nowhere to go
Engineers at NASA’s Johnson Space Center in Houston finished assembling the VIPER rover last month, and managers gave approval to put the craft through environmental testing to make sure VIPER could withstand the acoustics and vibrations of launch and the extreme temperature swings it would encounter in space.
Instead, NASA has canceled the mission after spending $450 million to get it to this point. “This is a very tough decision, but it is a decision based on budgetary concerns in a very constrained budget environment,” Fox told reporters Wednesday.
VIPER is about the size of a golf cart, with four wheels, headlights, a drill, and three science instruments to search for water ice in depressions near the Moon’s south pole that have been shaded from sunlight for billions of years. This has allowed these so-called permanently shadowed regions to become cold traps, allowing water ice to accumulate at or near the surface, where it could be accessible for future astronauts to use as drinking water or an oxygen source or to convert into electricity and rocket fuel.
But first, scientists need to know exactly where the water is located and how easy it is to reach. VIPER was supposed to be the next step in mapping resources on the Moon, providing ground truth measurements to corroborate remote sensing data from satellites in lunar orbit.
But late parts deliveries delayed construction of the VIPER rover, and in 2022, NASA ordered additional testing of Astrobotic’s Griffin lunar lander to improve the chances of a successful landing with VIPER. This delayed VIPER’s launch from late 2023 until late 2024, and at the beginning of this year, more supply chain issues with the VIPER rover and the Griffin lander pushed back the launch until September 2025.
This most recent delay raised the projected cost of VIPER more than 30 percent over the original cost of the mission, prompting a NASA termination review. While the rover is now fully assembled, NASA still needed to put it through a lengthy series of tests, complete development of the ground systems to control VIPER on the Moon, and deliver the craft to Astrobotic for integration onto the Griffin lander.
The remaining work to complete VIPER and operate it for 100 days on the lunar surface would have cost around $84 million, according to Kearns.
NASA built a Moon rover but can’t afford to get it to the launch pad Read More »


