Last year, astronomers discovered an unusual Earth-size exoplanet they believe has a hemisphere of molten lava, with its other hemisphere tidally locked in perpetual darkness. And at about the same time, a different group discovered a rare small, cold exoplanet with a massive outer companion 100 times the mass of Jupiter.
Meet Tylos
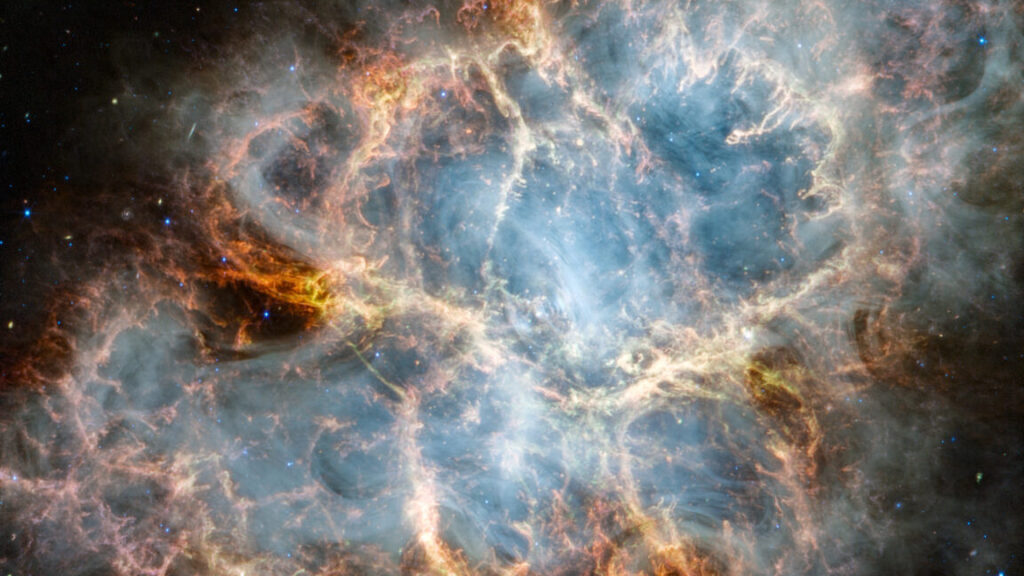
The different layers of the atmosphere on WASP-121b.
This latest research relied on observational data collected by the European South Observatory’s (ESO) Very Large Telescope, specifically, a spectroscopic instrument called ESPRESSO that can process light collected from the four largest VLT telescope units into one signal. The target exoplanet, WASP-121b—aka Tylos—is located in the Puppis constellation about 900 light-years from Earth. One year on Tylos is equivalent to just 30 hours on Earth, thanks to the exoplanet’s close proximity to its host star. Since one side is always facing the star, it is always scorching, while the exoplanet’s other side is significantly colder.
Those extreme temperature contrasts make it challenging to figure out how energy is distributed in the atmospheric system, and mapping out the 3D structure can help, particularly with determining the vertical circulation patterns that are not easily replicated in our current crop of global circulation models, per the authors. For their analysis, they combined archival ESPRESSO data collected on November 30, 2018, with new data collected on September 23, 2023. They focused on three distinct chemical signatures to probe the deep atmosphere (iron), mid-atmosphere (sodium), and shallow atmosphere (hydrogen).
“What we found was surprising: A jet stream rotates material around the planet’s equator, while a separate flow at lower levels of the atmosphere moves gas from the hot side to the cooler side. This kind of climate has never been seen before on any planet,” said Julia Victoria Seidel of the European Southern Observatory (ESO) in Chile, as well as the Observatoire de la Côte d’Azur in France. “This planet’s atmosphere behaves in ways that challenge our understanding of how weather works—not just on Earth, but on all planets. It feels like something out of science fiction.”
FRBs are of particular interest because they can be used as probes to study the large-scale structure of the universe. That’s why Calvin Leung, a postdoc at the University of California, Berkeley, was so excited to crunch data from Canada’s CHIME instrument (Canadian Hydrogen Intensity Mapping Experiment). CHIME was built for other observations but is sensitive to many of the wavelengths that make up an FRB. Unlike most radio telescopes, which focus on small points in the sky, CHIME scans a huge area, allowing it to pick out FRBs even though they almost never happen in the same place twice.
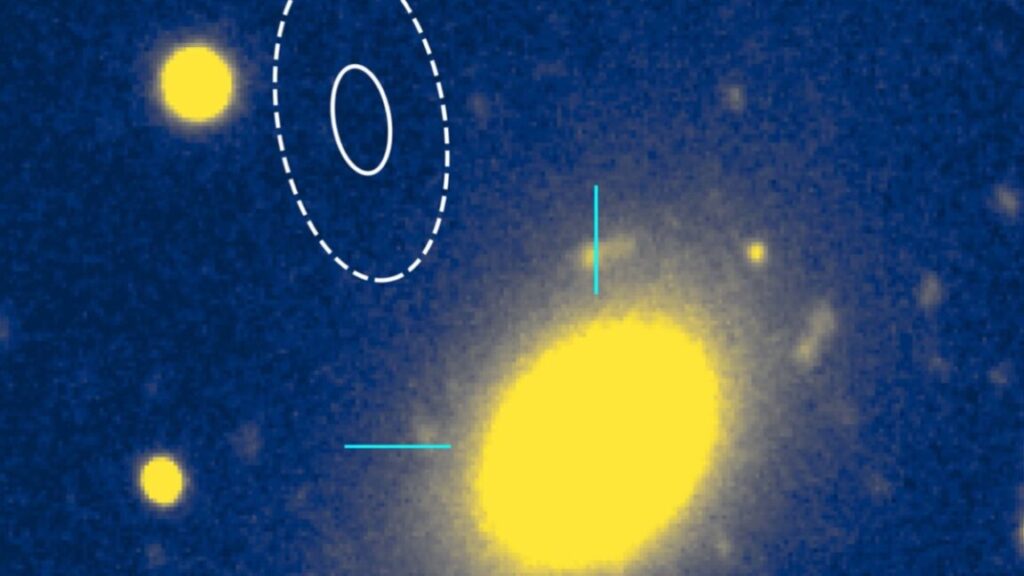
Leung was able to combine data from several different telescopes to narrow down the likely position of a repeating FRB, first detected in February 2024, located in the constellation Ursa Minor. When he and his CHIME collaborators further refined the accuracy of the location by averaging many bursts from the FRB, they discovered that this FRB originated on the outskirts of a long-dead distant galaxy. That throws a wrench into the magnetar hypothesis because why would a dead galaxy in which no new stars are forming host a magnetar?
It’s the first time an FRB has been found in such a location, and it’s also the furthest away from its galaxy. CHIME currently has two online outrigger radio arrays in place—companion telescopes to the original CHIME radio array in British Columbia. A third array comes online this week in Northern California, and according to Leung, it should enable astronomers to pinpoint FRB sources much more accurately—including this one. Data has already been incorporated from an outrigger in West Virginia, confirming the published position with a 20-times improvement in precision.
“This result challenges existing theories that tie FRB origins to phenomena in star-forming galaxies,” said co-author Vishwangi Shah, a graduate student at McGill University. “The source could be in a globular cluster, a dense region of old, dead stars outside the galaxy. If confirmed, it would make FRB 20240209A only the second FRB linked to a globular cluster.”
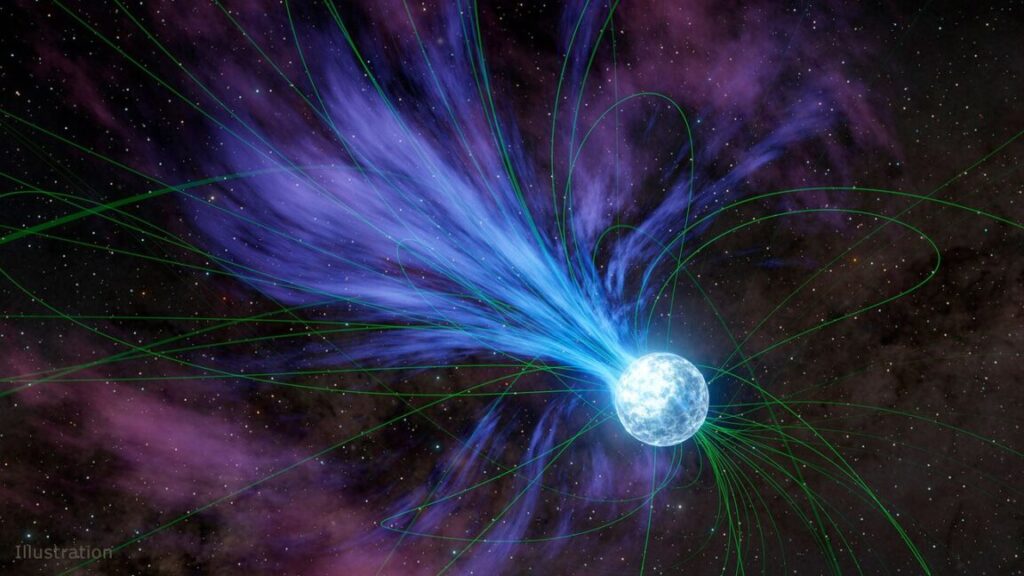
One of the two papers published on Wednesday looks at the polarization of the photons in the burst itself, finding that the angle of polarization changes rapidly over the 2.5 milliseconds that FRB 20221022A lasted. The 130-degree rotation that occurred follows an S-shaped pattern, which has already been observed in about half of the pulsars we’ve observed—neutron stars that rotate rapidly and sweep a bright jet across the line of sight with Earth, typically multiple times each second.
The implication of this finding is that the source of the FRB is likely to also be on a compact, rapidly rotating object. Or at least this FRB. As of right now, this is the only FRB that we know displays this sort of behavior. While not all pulsars show this pattern of rotation, half of them do, and we’ve certainly observed enough FRBs we should have picked up others like this if they occurred at an appreciable rate.
Scattered
The second paper performs a far more complicated analysis, searching for indications of interactions between the FRB and the interstellar medium that exists within galaxies. This will have two effects. One, caused by scattering off interstellar material, will spread the burst out over time in a frequency-dependent manner. Scattering can also cause a random brightening/dimming of different areas of the spectrum, called scintillation, and somewhat analogous to the twinkling of stars caused by our atmosphere.
In this case, the photons of the FRB have had three encounters with matter that can induce these effects: the sparse intersteller material of the source galaxy, the equally sparse interstellar material in our own Milky Way, and the even more sparse intergalactic material in between the two. Since the source galaxy for FRB 20221022A is relatively close to our own, the intergalactic medium can be ignored, leaving the detection with two major sources of scattering.
“In addition to stars, gas clouds can also be disrupted by SMBHs and their binaries,” they said in the same study. “The key difference is that the clouds can be comparable to or even larger than the binary separation, unlike stars, which are always much smaller. “
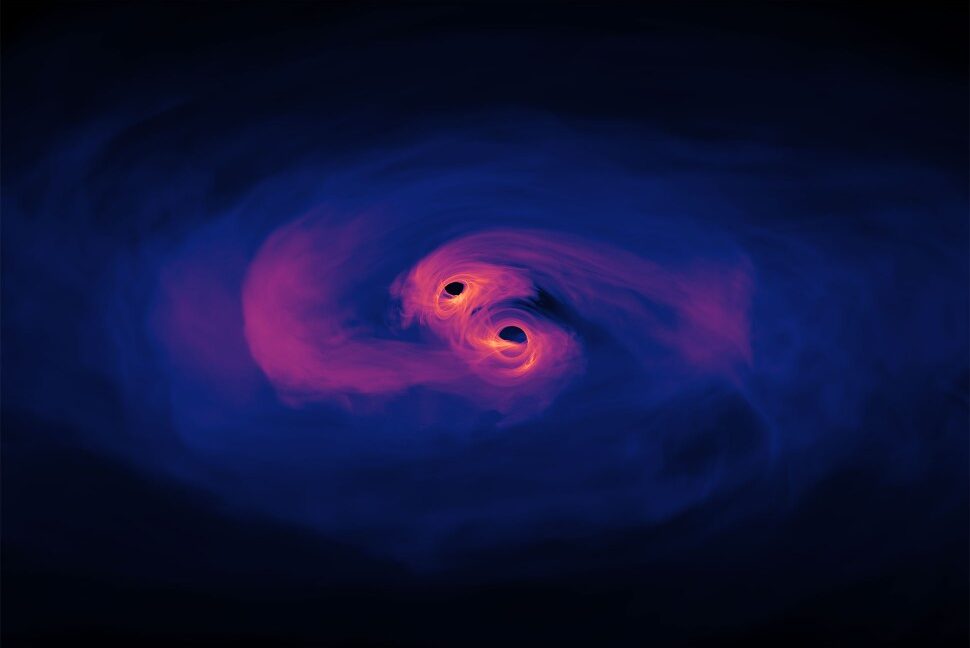
Looking at the results of a previous study that numerically modeled this type of situation also suggested a gas cloud. Just like the hypothetical supermassive black hole binary in the model, AT 2021hdr would accrete large amounts of material every time the black holes were halfway through orbiting each other and had to cross the cloud to complete the orbit—their gravity tears away some of the cloud, which ends up in their accretion disks, every time they cross it. They are now thought to take in anywhere between three and 30 percent of the cloud every few cycles. From a cloud so huge, that’s a lot of gas.
The supermassive black holes in AT 2021hdr are predicted to crash into each other and merge in another 70,000 years. They are also part of another merger, in which their host galaxy is gradually merging with a nearby galaxy, which was first discovered by the same team (this has no effect on the BSMBH tidal disruption of the gas cloud).
How the behavior of AT 2021hdr develops could tell us more about its nature and uphold or disprove the idea that it is eating away at a gaseous cloud instead of a star or something else. For now, it seems these black holes don’t just get gas from what they eat—they eat the gas itself.
Inspired by the Drake equation, researchers optimize a model universe for life.
Physicists including Robert H. Dickle and Fred Hoyle have argued that we are living in a universe that is perfectly fine-tuned for life. Following the anthropic principle, they claimed that the only reason fundamental physical constants have the values we measure is because we wouldn’t exist if those values were any different. There would simply have been no one to measure them.
But now a team of British and Swiss astrophysicists have put that idea to test. “The short answer is no, we are not in the most likely of the universes,” said Daniele Sorini, an astrophysicist at Durham University. “And we are not in the most life-friendly universe, either.” Sorini led a study aimed at establishing how different amounts of the dark energy present in a universe would affect its ability to produce stars. Stars, he assumed, are a necessary condition for intelligent life to appear.
But worry not. While our Universe may not be the best for life, the team says it’s still pretty OK-ish.
Expanding the Drake equation
Back in the 1960s, Frank Drake, an American astrophysicist and astrobiologist, proposed an equation aimed at estimating the number of intelligent civilizations in our Universe. The equation started with stars as a precondition for life and worked its way down in scale from there. How many new stars appear in the Universe per year? How many of the stars are orbited by planets? How many of those planets are habitable? How many of those habitable planets can develop life? Eventually, you’re left with the fraction of planets that host intelligent civilizations.
The problem with the Drake equation was that it wasn’t really supposed to yield a definite number. We couldn’t—and still can’t—know the values for most of its variables, like the fraction of the planets that developed life. So far, we know of only one such planet, and you can’t infer any statistical probabilities when you only have one sample. The equation was meant more as a guide for future researchers, giving them ideas of what to look for in their search for extraterrestrial life.
But even without knowing the actual values of all those variables present in the Drake equation, one thing was certain: The more stars you had at the beginning, the better the odds for life were. So Sorini’s team focused on stars.
“Our work is connected to the Drake equation in that it relies on the same logic,” Sorini said. “The difference is we are not adding to the life side of the equation. We’re adding to the stars’ side of the equation.” His team attempted to identify the basic constituents of a universe that’s good at producing stars.
“By ‘constituents,’ I mean ordinary matter, the stuff we are made of—the dark matter, which is a weirder, invisible type of matter, and the dark energy, which is what is making the expansion of a universe proceed faster and faster,” Sorinin explained. Of all those constituents, his team found that dark energy has a key influence on the star formation rate.
Into the multiverse
Dark energy accelerates the expansion of the Universe, counteracting gravity and pushing matter further apart. If there’s enough dark energy, it would be difficult to form the dark matter web that structures galaxies. “The idea is ‘more dark energy, fewer galaxies—so fewer stars,’” Sorini said.
The effect of dark energy in a universe can be modeled by a number called the cosmological constant. “You could reinterpret it as a form of energy that can make your universe expand faster,” Sorinin said.
(The cosmological constant was originally a number Albert Einstein came up with to fix the fact that his theory of general relativity caused the expansion of what was thought to be a static universe. Einstein later learned that the Universe actually was expanding and declared the cosmological constant his greatest blunder. But the idea eventually managed to make a comeback after it was discovered that the Universe’s expansion is accelerating.)
The cosmological constant was one of the variables Sorini’s team manipulated to determine if we are living in a universe that is maximally efficient at producing stars. Sorini based this work on an idea put forward by Steven Weinberg, a Nobel Prize-winning physicist, back in 1989. “Weinberg proposed that there could be a multiverse of all possible universes, each with a different value of dark energy,” Sorini explained. Sorini’s team modeled that multiverse composed of thousands upon thousands of possible universes, each complete with a past and future.
Cosmological fluke
To simulate the history of all those universes, Sorini used a slightly modified version of a star formation model he developed back in 2021 with John A. Peacock, a British astronomer at the University of Edinburgh, Scotland, and co-author of the study. It wasn’t the most precise model, but the approximations it suggested produced a universe that was reasonably close to our own. The team validated the results by predicting the stellar mass fraction in the total mass of the Milky Way Galaxy, which we know stands somewhere between 2.2 and 6.6 percent. The model came up with 6.7 percent, which was deemed good enough for the job.
In the next step, Sorini and his colleagues defined a large set of possible universes in which the value of the cosmological constant ranged from a very tiny fraction of the one we observe in our Universe all the way to the value 100,000 times higher than our own.
It turned out our Universe was not the best at producing stars. But it was decent.
“The value of the cosmological constant in the most life-friendly universe would be measured at roughly one-tenth of the value we observe in our own,” Sorini said.
In a universe like that, the fraction of the matter that gets turned into stars would stand at 27 percent. “But we don’t seem to be that far from the optimal value. In our Universe, stars are formed with around 23 percent of the matter,” Sorini said.
The last question the team addressed was how lucky we are to even be here. According to Sorini’s calculations, if all universes in the multiverse are equally likely, the chances of having a cosmological constant at or lower than the value present in our Universe is just 0.5 percent. In other words, we rolled the dice and got a pretty good score, although it could have been a bit better. The odds of getting a cosmological constant at one-tenth of our own or lower were just 0.2 percent.
Things also could have been much worse. The flip side of these odds is that the number of possible universes that are worse than our own vastly exceeds the number of universes that are better.
“That is of course all subject to the assumptions of our model, and the only assumption about life we made was that more stars lead to higher chances for life to appear,” Sorini said. In the future, his team plans to go beyond that idea and make the model more sophisticated by considering more parameters. “For example, we could ask ourselves what the chances are of producing carbons in order to have life as we know it or something like that,” Sorini said.
Jacek Krywko is a freelance science and technology writer who covers space exploration, artificial intelligence research, computer science, and all sorts of engineering wizardry.
From its halo-like orbit nearly a million miles from Earth, the James Webb Space Telescope is seeing farther than human eyes have ever seen.
In May, astronomers announced that Webb detected the most distant galaxy found so far, a fuzzy blob of red light that we see as it existed just 290 million years after the Big Bang. Light from this galaxy, several hundreds of millions of times the mass of the Sun, traveled more than 13 billion years until photons fell onto Webb’s gold-coated mirror.
A few months later, in July, scientists released an image Webb captured of a planet circling a star slightly cooler than the Sun nearly 12 light-years from Earth. The alien world is several times the mass of Jupiter and the closest exoplanet to ever be directly imaged. One of Webb’s science instruments has a coronagraph to blot out bright starlight, allowing the telescope to resolve the faint signature of a nearby planet and use spectroscopy to measure its chemical composition.
These are just a taste of the discoveries made by the $10 billion Webb telescope since it began science observations in 2022. Judging by astronomers’ interest in using Webb, there are many more to come.
Breaking records
The Space Telescope Science Institute, which operates Webb on behalf of NASA and its international partners, said last week that it received 2,377 unique proposals from science teams seeking observing time on the observatory. The institute released a call for proposals earlier this year for the so-called “Cycle 4” series of observations with Webb.
This volume of proposals represents around 78,000 hours of observing time with Webb, nine times more than the telescope’s available capacity for scientific observations in this cycle. The previous observing cycle had a similar “oversubscription rate” but had less overall observing time available to the science community.
Similar feeding events could explain the rapid growth of supermassive black holes.
How did supermassive black holes end up at the center of every galaxy? A while back, it wasn’t that hard to explain: That’s where the highest concentration of matter is, and the black holes had billions of years to feed on it. But as we’ve looked ever deeper into the Universe’s history, we keep finding supermassive black holes, which shortens the timeline for their formation. Rather than making a leisurely meal of nearby matter, these black holes have gorged themselves in a feeding frenzy.
With the advent of the Webb Space Telescope, the problem has pushed up against theoretical limits. The matter falling into a black hole generates radiation, with faster feeding meaning more radiation. And that radiation can drive off nearby matter, choking off the black hole’s food supply. That sets a limit on how fast black holes can grow unless matter is somehow fed directly into them. The Webb was used to identify early supermassive black holes that needed to have been pushing against the limit for their entire existence.
But the Webb may have just identified a solution to the dilemma as well. It has spotted a black hole that appears to have been feeding at 40 times the theoretical limit for millions of years, allowing growth at a pace sufficient to build a supermassive black hole.
Setting limits
Matter falling into a black hole generally gathers into what’s called an accretion disk, orbiting the body and heating up due to collisions with the rest of the disk, all while losing energy in the form of radiation. Eventually, if enough energy is lost, the material falls into the black hole. The more matter there is, the brighter the accretion disk gets, and the more matter that gets driven off before it can fall in. The point where the radiation pressure drives away as much matter as the black hole pulls in is called the Eddington Limit. The bigger the black hole, the higher this limit.
It is possible to exceed the Eddington Limit if matter falls directly into the black hole without spending time in the accretion disk, but it requires a fairly distinct configuration of nearby clouds of gas, something that’s unlikely to persist for more than a few million years.
That creates a problem for supermassive black holes. The only way we know to form a black hole—the death of a massive star in a supernova—tends to produce them with only a few times the mass of the Sun. Even assuming unusually massive stars in the early Universe, along with a few black hole mergers, it’s expected that most of the potential seeds of a supermassive black hole are in the area of 100 times the Sun’s mass. There are theoretical ideas about the direct collapse of gas clouds that avoid the intervening star formation and immediately form a black hole with 10,000 times the mass of the Sun or more, but they remain entirely hypothetical.
In either case, black holes would need to suck down a lot of matter before reaching supermassive proportions. But most of the early supermassive black holes spotted using the Webb are feeding at roughly 20 percent of the Eddington limit, based on their lack of X-ray emissions. This either means that they fed at well beyond the Eddington Limit earlier in their history or that they started their existences as very heavy black holes.
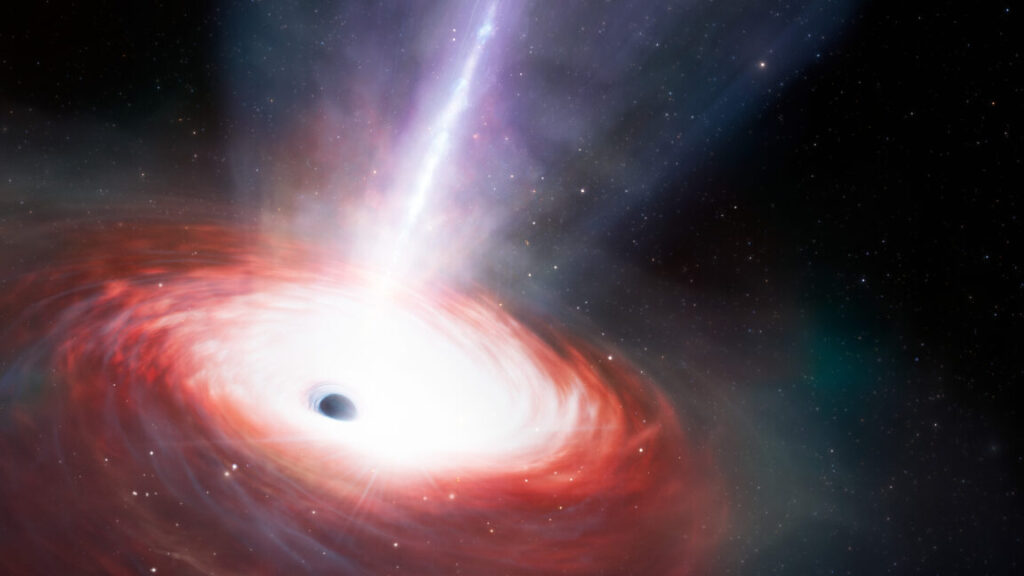
The object that’s the focus of this new report, LID-568, was first spotted using the Chandra X-ray Telescope (an observatory that was recently threatened with shutdown). LID-568 is luminous at X-ray wavelengths, which is why Chandra could spot it, and suggests the possibility that it is feeding at an extremely high rate. Imaging in the infrared shows that it appears to be a point source, so the research team concluded that most of the light we’re seeing comes directly from the accretion disk, rather than from the stars in the galaxy it occupies.
But that made it difficult to determine any details about the black hole’s environment or to figure out how old it was relative to the Big Bang at the time we’re viewing it. So, the researchers pointed the Webb at it to capture details that other observatories couldn’t image.
A fast eater
Use of spectroscopy revealed that we were viewing LID-568 as it existed about 1.5 billion years after the Big Bang. The emissions from gas and dust in the area were low, which suggests that the black hole resides in a dwarf galaxy. Based on the emission of hydrogen, the researchers estimate that the black hole is roughly a million times the mass of the Sun—nothing you’d want to get close to, but small compared to many supermassive black holes.
It’s actually similar in mass to a number of black holes the Webb was used to identify in galaxies that are considerably older. But it’s much, much brighter (as bright as something 10 times heavier) and includes the X-ray emissions that those lack. In fact, it’s so bright compared to its mass that the researchers estimate that it could only produce that much radiation if it were feeding at well above the Eddington Limit. Ultimately, they estimate that it’s exceeding the Eddington Limit by a factor of over 40.
Critically, the Webb was able to identify two lobes of material that were moving toward us at high velocities, based on the blue shifting of hydrogen emissions lines. These suggest that the material is moving at over 500 kilometers a second and stretched for tens of thousands of light years away from the black hole. (Presumably, these obscured similar blobs of material moving away from us.) Given their length and apparent velocity, and assuming they represent gas driven off by the black hole, the researchers estimated how long it was emitting this intense radiation.
Working back from there, they estimate the black hole’s original mass was about 100 times that of the Sun. “This lifetime suggests that a substantial fraction of the mass growth of LID-568 may have occurred in a single, super-Eddington accretion episode,” they conclude. For that to work, the black hole had to have ended up in a giant molecular cloud and stayed there feeding for over 10 million years.
The researchers suspect that this intense activity interfered with star formation in the galaxy, which is one of the reasons that it is relatively star-poor. That may explain why we see some very massive black holes at the center of relatively small galaxies in the present Universe.
So what does this mean?
In some ways, this is potentially good news for cosmologists. Forming supermassive black holes as quickly as the size/age of those observed by Webb would seemingly require them to have fed at or slightly above the Eddington Limit for most of their history, which was easy to view as unlikely. If the Eddington Limit can be exceeded by a factor of 40 for over 10 million years, however, this seems to be less of an issue.
But, at the same time, the graph showing mass versus luminosity of supermassive black holes the research team generated shows that LID-568 is in a class by itself. If there were a lot of black holes feeding at these rates, it should be easy to identify more. And it’s a safe bet that these researchers are checking other X-ray sources to see if there are additional examples.
John is Ars Technica’s science editor. He has a Bachelor of Arts in Biochemistry from Columbia University, and a Ph.D. in Molecular and Cell Biology from the University of California, Berkeley. When physically separated from his keyboard, he tends to seek out a bicycle, or a scenic location for communing with his hiking boots.
It might not come as a surprise to learn that Lin is a badminton player. “The experience of playing badminton is really the thing that kick-started the idea and led me to ask the right questions,” he said.
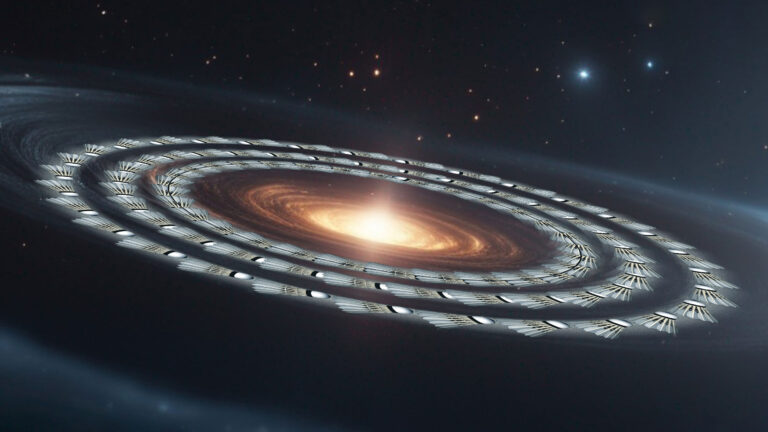
Previous explanations attribute the dust alignment to the magnetic influence of the central star, the physics of which can be complicated and not always intuitive. The beauty of the proposed birdie mechanism is its simplicity. “It’s a very good first step,” said Bing Ren, an astronomer at France’s Côte d’Azur Observatory who wasn’t involved in the study.
Still, the birdie-alignment hypothesis is just that—a hypothesis. To confirm whether it holds water, scientists will need to throw their full observational arsenal at protoplanetary disks, such as viewing them at different wavelengths, to sniff out the finer details of particle-gas interactions.
Tracing invisible gas
Real-life protoplanetary disks are likely more complicated than a uniform squadron of space potatoes suspended in thin air. Ren suspects that the grains come in various shapes, sizes, and speeds. Nevertheless, he says Lin’s study is a good foundation for computer models of interstellar clouds, onto which scientists can tack layers of complexity.
The new research points a way forward for probing protoplanetary disks, particularly gas behavior. Given that the grains trace the gas direction, studying dust organization using existing tools like polarized light can allow scientists to map a disk’s aerodynamic flow. Essentially, these grains are tiny flags that signal where the wind blows.
As granular as the details are, the dust alignment is a small but key step in a grand journey of particle-to-planet progression. The nitty-gritty of a particle’s conduct will determine its fate for millions of years—perhaps the primordial seed will hoover up hydrogen and helium to become a gas giant or amass dust to transform into a terrestrial world like Earth. It all starts with it flailing or keeping steady amid a sea of other specks.
Shi En Kim is a DC-based freelance journalist who writes about health, the environment, technology, and the physical sciences. She and three other journalists founded Sequencer Magazine in early 2024. Occasionally, she creates art to accompany her writings or does it simply for fun. Follow her on Twitter at @goes_by_kim, or see more of her work on her personal website.
Our Solar System’s Kuiper Belt appears to be substantially larger than we thought.
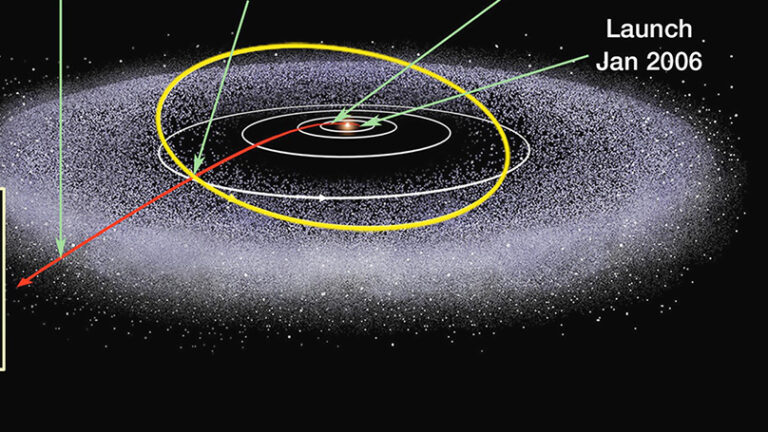
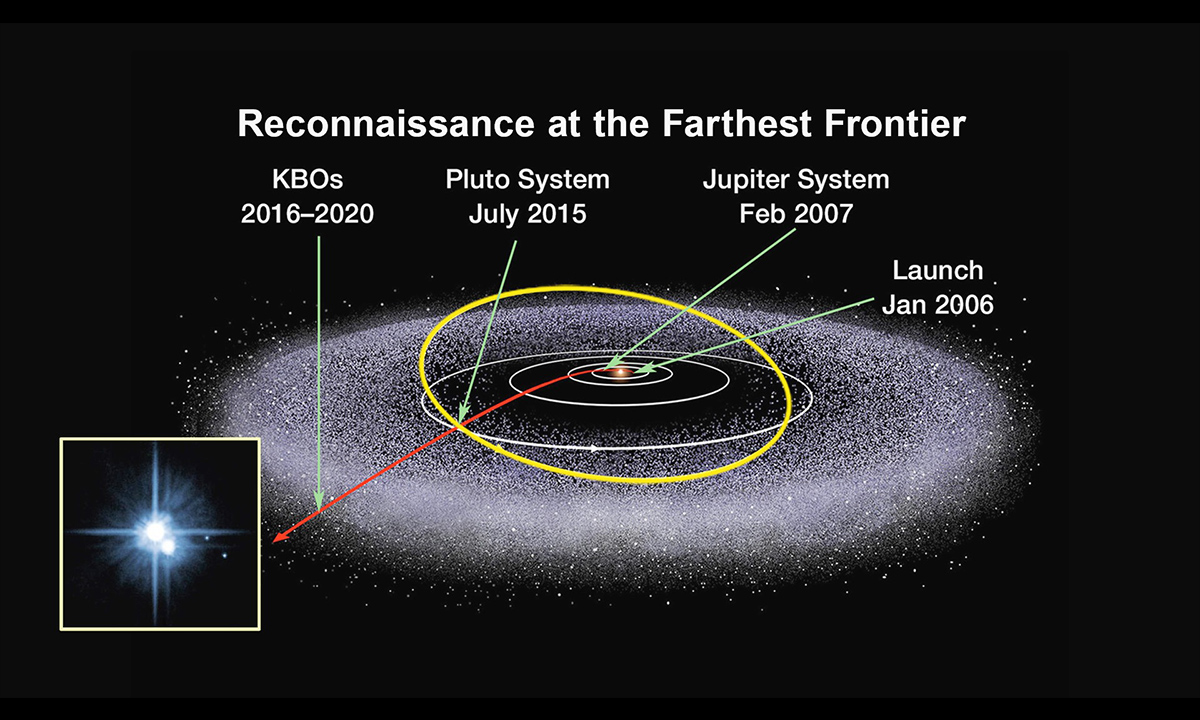
Back in 2017, NASA graphics indicated that New Horizons would be at the outer edge of the Kuiper Belt by around 2020. That hasn’t turned out to be true. Credit: NASA
Back in 2017, NASA graphics indicated that New Horizons would be at the outer edge of the Kuiper Belt by around 2020. That hasn’t turned out to be true. Credit: NASA
In the outer reaches of the Solar System, beyond the ice giant Neptune, lies a ring of comets and dwarf planets known as the Kuiper Belt. The closest of these objects are billions of kilometers away. There is, however, an outer limit to the Kuiper Belt. Right?
Until now, it was thought there was nothing beyond 48 AU (astronomical units) from the Sun, (one AU is slightly over 150 million km). It seemed there was little beyond that. That changed when NASA’s New Horizons team detected 11 new objects lurking from 60 to 80 AU. What was thought to be empty space turned out to be a gap between the first ring of Kuiper Belt objects and a new, second ring. Until now, it was thought that our Solar System is unusually small when compared to exosolar systems, but it evidently extends farther out than anyone imagined.
While these objects are only currently visible as pinpoints of light, and Fraser is allowing room for error until the spacecraft gets closer, what their existence could tell us about the Kuiper Belt and the possible origins of the Solar System is remarkable.
Living on the edge
The extreme distance of the new objects has put them in a class all their own. Whether they are similar to other Kuiper Belt objects in morphology and composition remains unknown since they are so faint. As New Horizons approaches them, observations are now simultaneously being made with its LORRI (Long Range Reconnaissance Imager) telescope and the Subaru Telescope, which might reveal that they actually do not belong to a different class in terms of composition.
“The reason we’re using Subaru is its Hyper Suprime-Cam, which has a really wide field of vision,” New Horizons researcher Wesley Fraser, who led the study, told Ars Technica (the results are soon to be published in the Planetary Science Journal). “The camera can go deep and wide quickly, and we stare down the pipe of LORRI, looking down that trajectory to find anything nearby.”
These objects are near the edge of the heliosphere of the Solar System, where it transitions to interstellar space. The heliosphere is formed by the outflow of charged particles, or solar wind, that creates something of a bubble around our Solar System; combined with the Sun’s magnetic field, this protects us from outside cosmic radiation.
The new objects are located where the strength of the Sun’s magnetic field starts to break down. They might even be far enough for their orbits to occasionally take them beyond the heliosphere, where they will be pummeled by intense cosmic radiation from the interstellar medium. This, combined with their solar wind exposure, might affect their composition, making it different from that of closer Kuiper Belt objects.
Even though it is impossible to know what these objects are like up close for now, how can we think of them? Fraser has an idea.
“If I had to guess, they are probably red and dark and devoid of water ice on the surface, which is quite common in the Kuiper Belt,” he said. “I think these objects will look a lot like the dwarf planet Sedna, but it’s possible they will look even more unusual.”
Many Kuiper Belt objects are a deep reddish color as a result of their organic chemicals being exposed to cosmic radiation. This breaks the hydrogen bonds in those chemicals, releasing much of the hydrogen into space and leaving behind an amorphous organic sludge that keeps getting redder the longer it is irradiated.
Fraser also predicts these objects are lacking in surface water ice because more distant Kuiper Belt objects (though not nearly as far-flung as the newly discovered ones) have not shown signs of it in observations. While water ice is common in the Kuiper Belt, he thinks these objects are probably hiding water ice underneath their red exterior.
Emerging from the dark
Investigating objects like this could change views on the origins of the Solar System and how it compares to the exosolar systems we have observed. Is our Solar System even normal?
Because the Kuiper Belt was thought to end at a distance of about 48 AU, the Solar System used to seem small compared to exosolar systems, where there are still objects floating around 150 AU from their star. The detection of objects at up to 80 AU from the Sun has put the Solar System in more of a normal range. It also seems to suggest that, since it is larger than we thought, that it also formed in a larger nebula.
“The timeline for Solar System formation is what we have to work out, and looking at the Kuiper Belt sets the stage for that very earliest moment, when gas and dust start to coalesce into macroscopic objects,” said New Horizons researcher Marc Buie. Buie discovered the object Arrokoth and led another study recently published in The Planetary Science Journal.
Arrokoth itself altered ideas about planet formation since its two lobes appear to have gently stuck together instead of crashing into each other in a violent collision, as some of our ideas had assumed. Nothing like it has ever been observed before or since.
Dust to dust
There is another potential thing that the New Horizons team is watching out for, and that is whether the new objects are binary.
About 10 to 15 percent of all known Kuiper Belt objects orbit partners in binary systems, and Fraser thinks binarity can reveal many things about the formation of planetesimals, solid objects that form in a young star system through gentle mergers with other objects that cause them to stick together. Some of these objects can become gravitationally bound to each other and form binaries.
As New Horizons travels farther, its dust counter, which sends back information about the velocity and mass of dust that hits it, shows that the amount of dust in its surroundings has not gone down. This dust comes from objects running into each other.
“It’s been finding that, as we go farther and farther out, the Solar System is getting dustier and dustier, which is exactly the opposite of what is expected at that distance,” New Horizons Principal Investigator Alan Stern told Ars Technica. “There might be a massive population of bodies colliding out there.”
NASA had previously decided that it was unlikely New Horizons would be able to pull off another Kuiper Belt object flyby like it did with Arrokoth, so the mission’s focus shifted to the heliosphere. Now that the New Horizons team has found unexpected objects this distant with the help of the Subaru Telescope, and dust keeps being detected as the spacecraft travels farther out, there might be an opportunity for another flyby. Stern is still cautious about the chances of that.
“We’re going to see how they compare to closer Kuiper Belt objects, but if we can find one we can get close to, we’ll get a chance to really compare their geology and their mode of origin,” Stern said. “But that’s a longshot because we’re running on a tenth of a tank of gas.”
The advantage of using Subaru combined with LORRI is that LORRI can be pointed sideways to see objects, or at least slightly past them, at right angles. This will be the dream team of telescopes if New Horizons can approach at least one of the new objects. If an object is behind the spacecraft, combining observations from different angles gives information about the physical surface of an object.
Using the Nancy Grace Roman Telescope could yield even more surprising observations in the future. It has a smaller mirror and a very wide field of view, Stern likens it to space binoculars, and it only has to be pointed at a target region once or twice (in comparison to hundreds of times for the James Webb Space Telescope) to search for and possibly discover objects in an extremely vast expanse of sky. Most other telescopes would have to be pointed thousands of times to do that.
“The desperate hope for all of us is that we will find more flyby targets,” Buie said. “If we could just get an object to register as a couple of pixels on LORRI, that would be incredible.”
Just a note to you on some stuff that’s going on in the background here. About a year ago, NASA decided that another KBO flyby was really unlikely, so they switched the mission focus to heliophysics (i.e., the edge of the heliosphere). Stern tried to fight that, and he has really looked to keep the focus on KBOs, which NASA now considers a “if we find one it can image, it will” situation. So I think a lot of his phrasing is in keeping with what he wants—more flybys. But it’s our job to give an accurate picture, which is that this event is unlikely.
Elizabeth Rayne is a creature who writes. Her work has appeared on SYFY WIRE, Space.com, Live Science, Grunge, Den of Geek, and Forbidden Futures. She lurks right outside New York City with her parrot, Lestat. When not writing, she is either shapeshifting, drawing, or cosplaying as a character nobody has ever heard of. Follow her on Threads and Instagram @quothravenrayne.
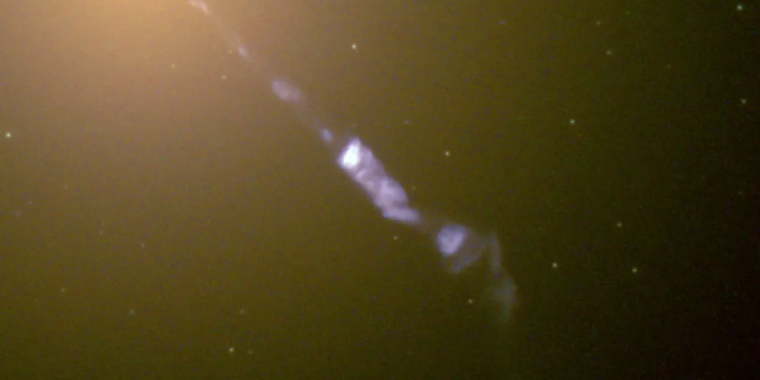
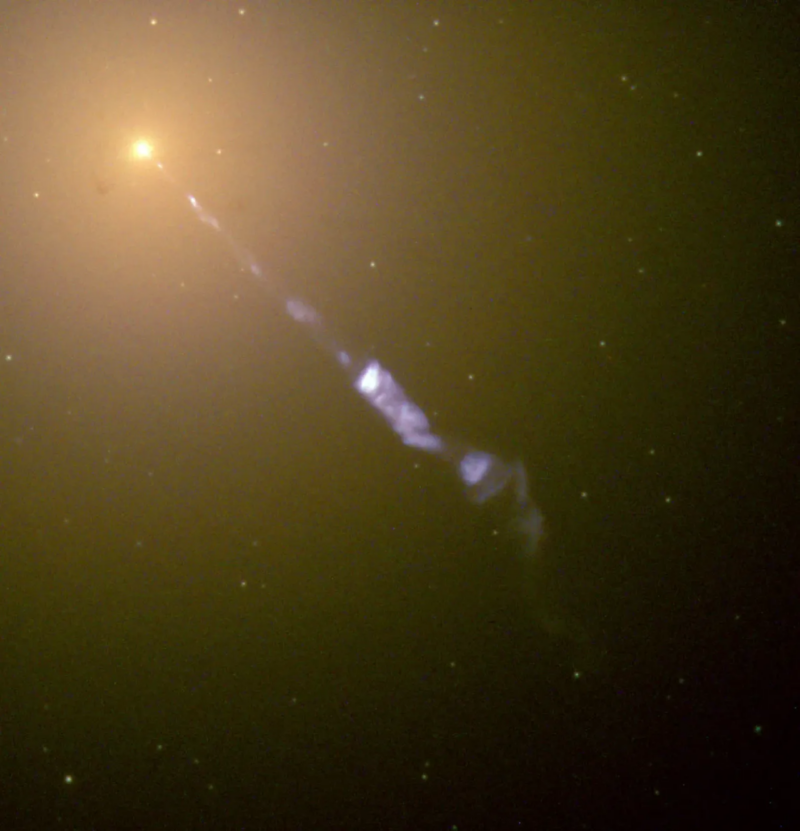
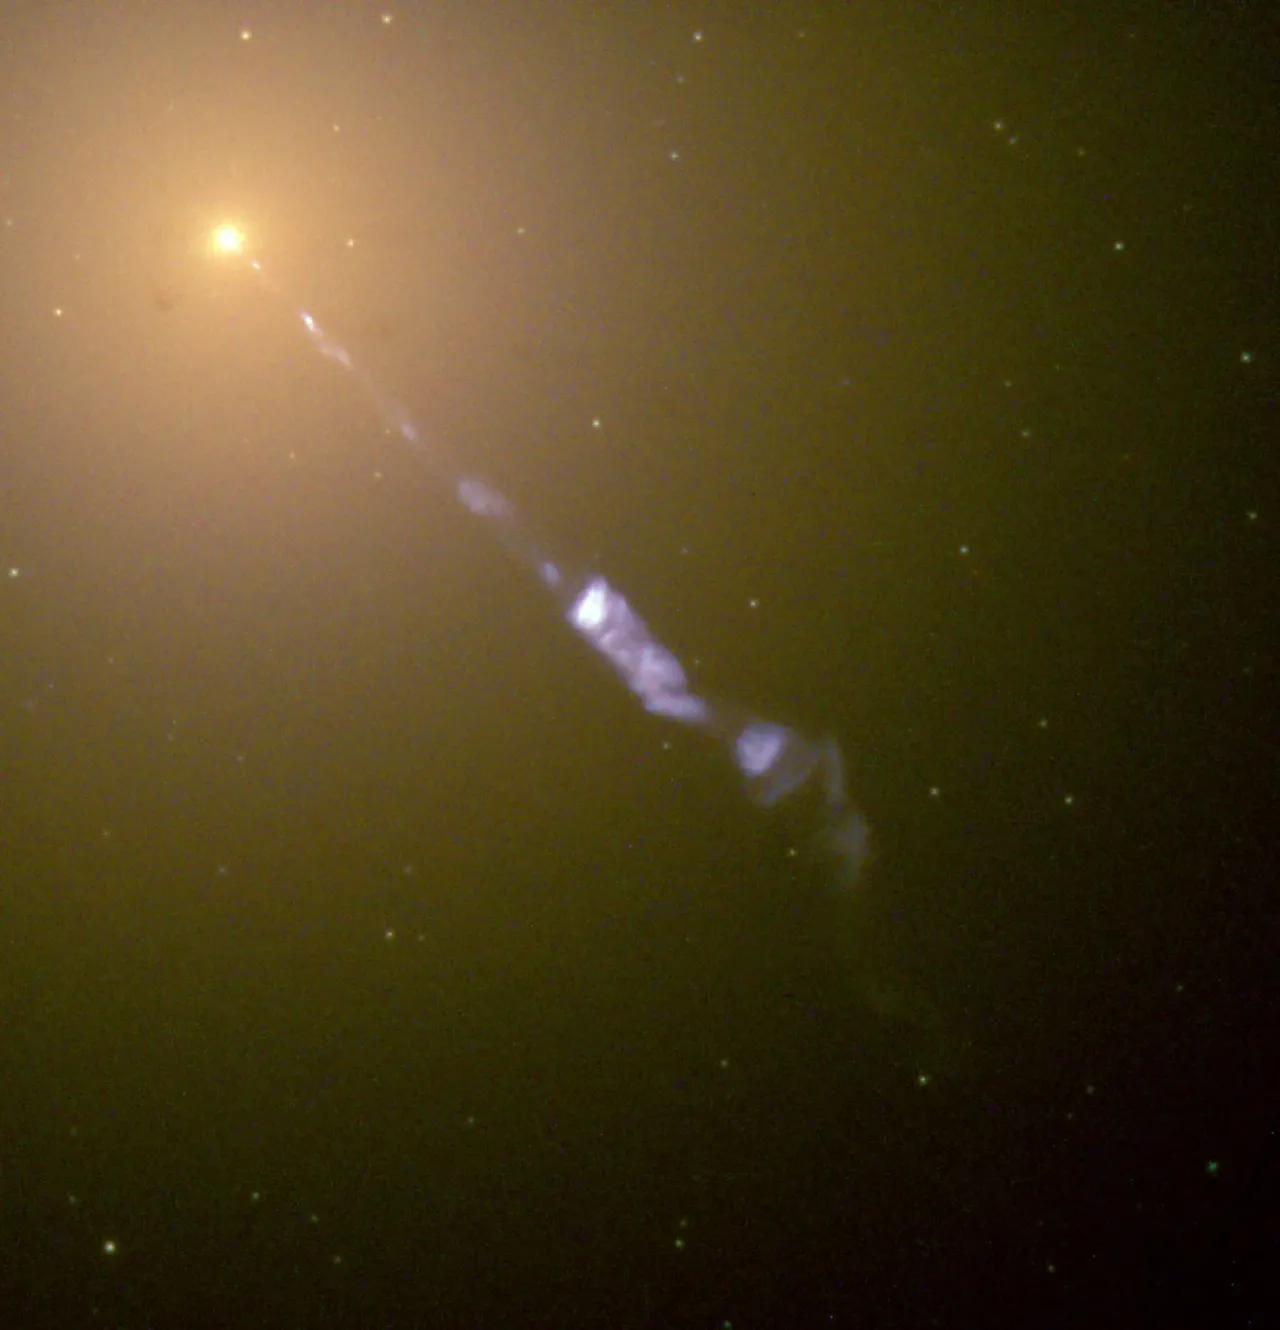
Enlarge/ One of the jets emitted by galaxy M87’s central black hole.
The intense electromagnetic environment near a black hole can accelerate particles to a large fraction of the speed of light and sends the speeding particles along jets that extend from each of the object’s poles. In the case of the supermassive black holes found in the center of galaxies, these jets are truly colossal, blasting material not just out of the galaxy, but possibly out of the galaxy’s entire neighborhood.
But this week, scientists have described how the jets may be doing some strange things inside of a galaxy, as well. A study of the galaxy M87 showed that nova explosions appear to be occurring at an unusual high frequency in the neighborhood of one of the jets from the galaxy’s central black hole. But there’s absolutely no mechanism to explain why this might happen, and there’s no sign that it’s happening at the jet that’s traveling in the opposite direction.
Whether this effect is real, and whether we can come up with an explanation for it, may take some further observations.
Novas and wedges
M87 is one of the larger galaxies in our local patch of the Universe, and its central black hole has active jets. During an earlier period of regular observations, the Hubble Space Telescope had found that stellar explosions called novas appeared to be clustered around the jet.
This makes very little sense. Novas occur in systems with a large, hydrogen-rich star, with a nearby white dwarf in orbit. Over time, the white dwarf draws hydrogen off the surface of its companion, until it reaches a critical mass on its surface. At that point, a thermonuclear explosion blasts the remaining material off the white dwarf, and the cycle resets. Since the rate of material transfer tends to be fairly stable, novas in a stellar system will often repeat at regular intervals. And it’s not at all clear why a black hole’s jet would alter that regularity.
So, some of the people involved in the first study got time on the Hubble to go back and have another look. And for a big chunk of a year, every five days, Hubble was pointed at M87, allowing it to capture novas before they faded back out. All told, this picked up 94 novas that occurred near the center of the galaxy. Combined with 41 that had been identified during earlier work, this left a collection of 135 novas in this galaxy. The researchers then plotted these relative to the black hole and its jets.
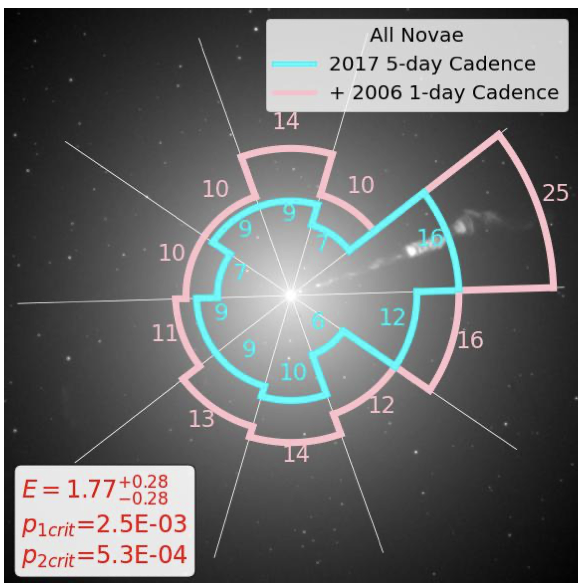
The area containing the jet (upper right) experiences significantly more novas than the rest of the galaxy’s core.
Lessing et. al.
Dividing the area around the center of the galaxy into 10 equal segments, the researchers counted the novas that occurred in each. In the nine segments that didn’t include the jet on the side of the galaxy facing Earth, the average number of novas was 12. In the segment that included the jet, the count was 25. Another way to look at this is that the highest count in a non-jet segment was only 16—and that was in a segment immediately next to the one with the jet in it. The researchers calculate the odds of this arrangement occurring at random as being about one in 1,310 (meaning less than 0.1 percent).
To get a separate measure of how unusual this is, the researchers placed 8 million novas around the center of the galaxy, with the distribution being random but biased to match the galaxy’s brightness under the assumption that novas will be more frequent in areas with more stars. This was then used to estimate how often novas should be expected in each of these segments. They then used a wide variety of wedges: “In order to reduce noise and avoid p-hacking when choosing the size of the wedge, we average the results for wedges between 30 and 45 degrees wide.”
Overall, the enhancement near the jet was low for either very narrow or very wide wedges, as you might expect—narrow wedges crop out too much of the area affected by the jet, while wide ones include a lot of space where you get the normal background rate. Things peak in the area of wedges that are 25 degrees wide, where the enrichment near the jet is about 2.6-fold. So, this appears to be real.
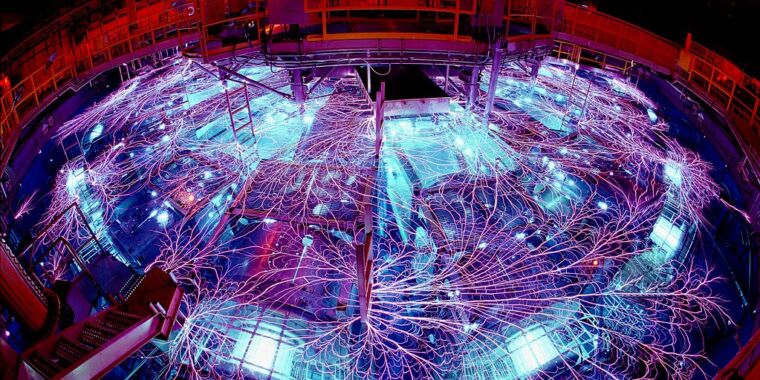
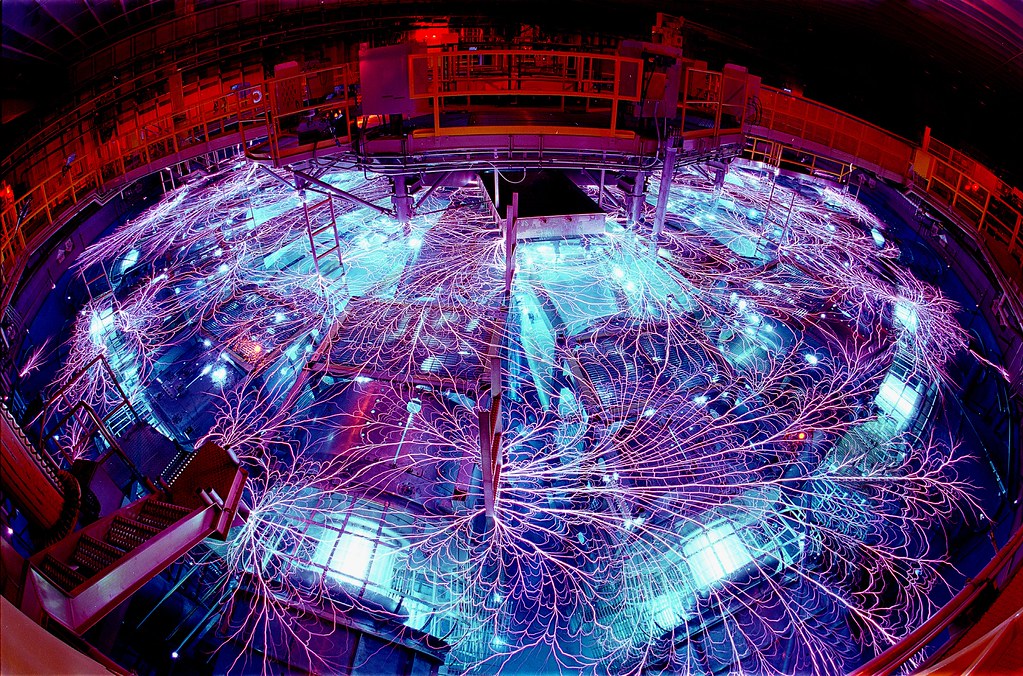
Enlarge/ Sandia National Labs’ Z machine in action.
The old joke about the dinosaurs going extinct because they didn’t have a space program may be overselling the need for one. It turns out you can probably divert some of the more threatening asteroids with nothing more than the products of a nuclear weapons program. But it doesn’t work the way you probably think it does.
Obviously, nuclear weapons are great at destroying things, so why not asteroids? That won’t work because a lot of the damage that nukes generate comes from the blast wave as it propagates through the atmosphere. And the environment around asteroids is notably short on atmosphere, so blast waves won’t happen. But you can still use a nuclear weapon’s radiation to vaporize part of the asteroid’s surface, creating a very temporary, very hot atmosphere on one side of the asteroid. This should create enough pressure to deflect the asteroid’s orbit, potentially causing it to fly safely past Earth.
But will it work? Some scientists at Sandia National Lab have decided to tackle a very cool question with one of the cooler bits of hardware on Earth: the Z machine, which can create a pulse of X-rays bright enough to vaporize rock. They estimate that a nuclear weapon can probably impart enough force to deflect asteroids as large as 4 kilometers across.
No nukes! (Just a nuclear simulation)
The Z machine is at the heart of Sandia’s Z Pulsed Power Facility. It’s basically a mechanism for storing a whole lot of electrical energy—up to 22 megajoules—and releasing it nearly instantaneously. Anything in the immediate vicinity experiences extremely intense electromagnetic fields. Among other things, this can be used to heavily ionize materials, like the argon gas used here, generating intense X-rays. These served as a stand-in for the radiation generated by a nuclear weapon.
For an asteroid, the researcher used disks of rock, either quartz or fused silica. (Notably, they only did one sample of each but got reasonably consistent results from them.) Mere mortals might have stuck the disk on a device that could register the force it experienced and left it at that. But these scientists were made of sterner stuff and decided that this wouldn’t really replicate the asteroid experience of floating freely in space.
To mimic that, the researchers held the rock disks in place using thin pieces of foil. These would vaporize almost instantly as the X-ray burst arrives, leaving the rock briefly suspended in the air. While gravity would have its way, the events triggered by the radiation evaporating away a bunch of the rock would be over before the sample experienced any significant downward acceleration. Its movement during this time, and thus the force imparted to it by the evaporation of its surface, was tracked by a laser interferometer placed on the far side of the disk from the X-ray source.
With all that set, all that was left was to fire up the Z machine and vaporize some rock.
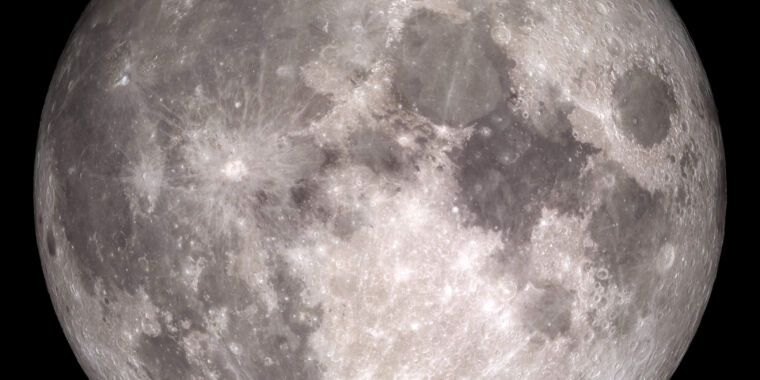
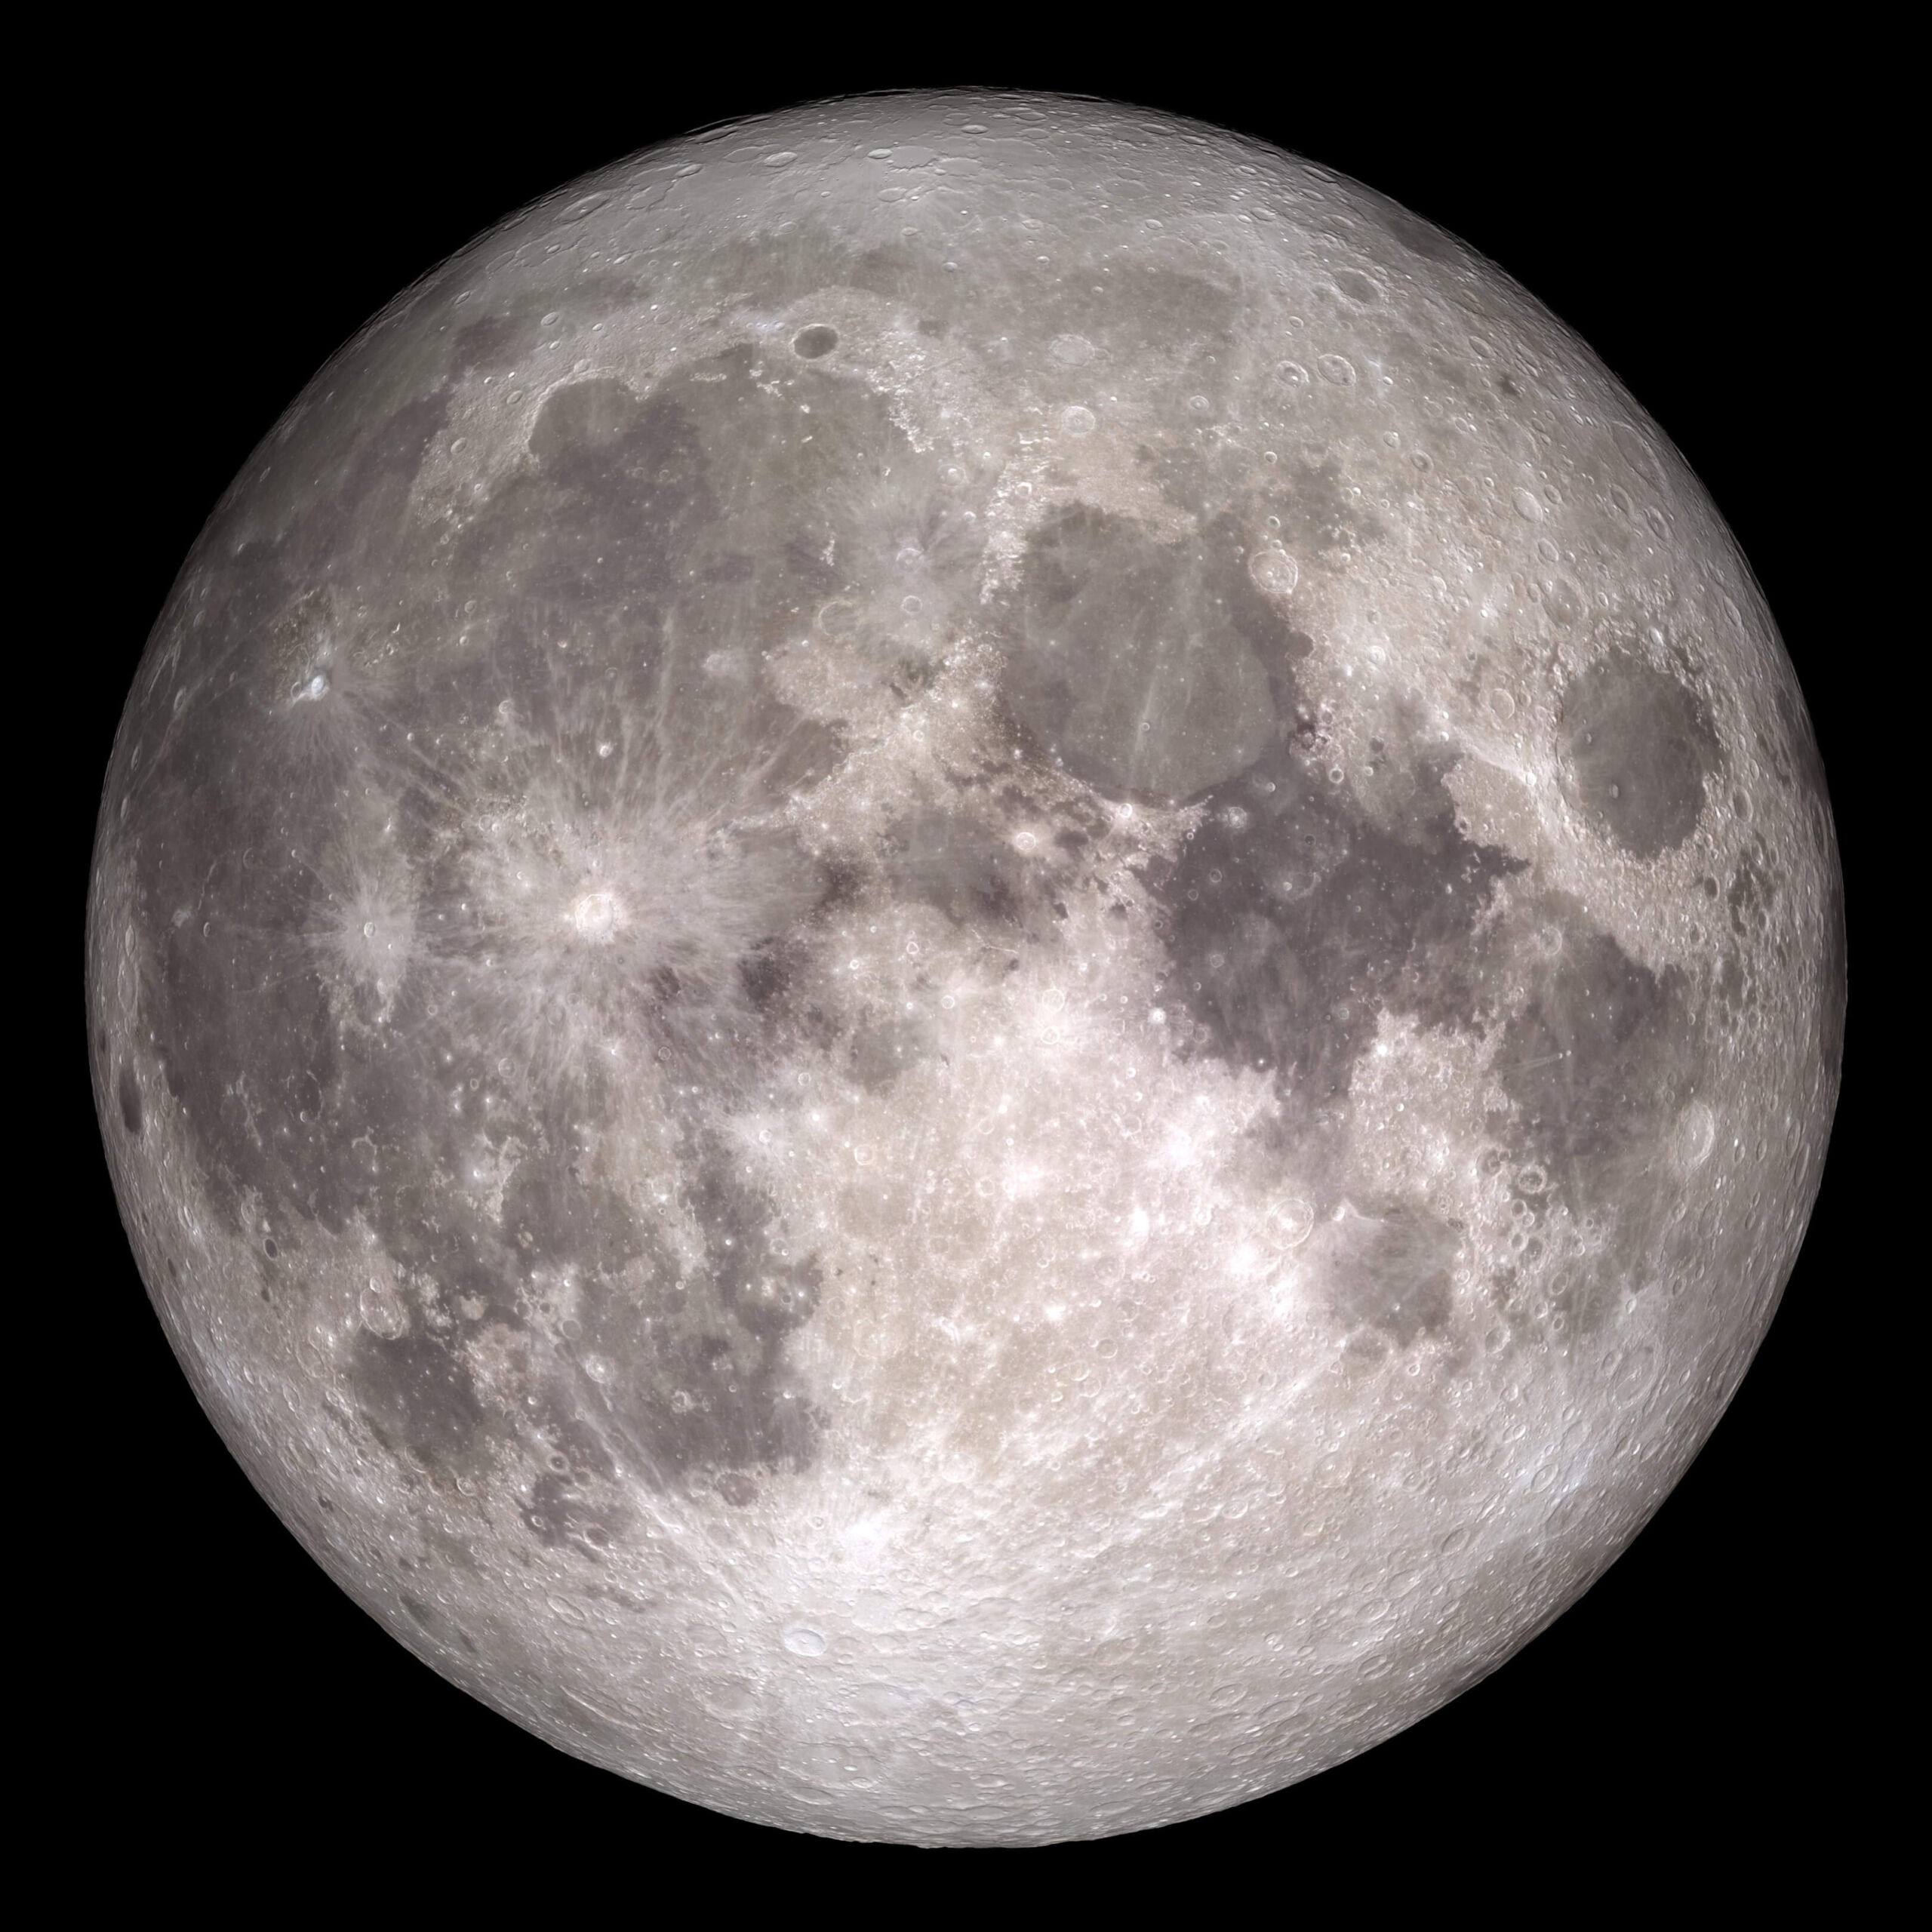
Enlarge/ The eruptions that produced the dark mare on the lunar surface ended billions of years ago.
Signs of volcanic activity on the Moon can be viewed simply by looking up at the night-time sky: The large, dark plains called “maria” are the product of massive outbursts of volcanic material. But these were put in place relatively early in the Moon’s history, with their formation ending roughly 3 billion years ago. Smaller-scale additions may have continued until roughly 2 billion years ago. Evidence of that activity includes samples obtained by China’s Chang’e-5 lander.
But there are hints that small-scale volcanism continued until much more recent times. Observations from space have identified terrain that seems to be the product of eruptions, but only has a limited number of craters, suggesting a relatively young age. But there’s considerable uncertainty about these deposits.
Now, further data from samples returned to Earth by the Chang’e-5 mission show clear evidence of volcanism that is truly recent in the context of the history of the Solar System. Small beads that formed during an eruption have been dated to just 125 million years ago.
Counting beads
Obviously, some of the samples returned by Chang’e-5 are solid rock. But it also returned a lot of loose material from the lunar regolith. And that includes a decent number of rounded, glassy beads formed from molten material. There are two potential sources of those beads: volcanic activity and impacts.
The Moon is constantly bombarded by particles ranging in size from individual atoms to small rocks, and many of these arrive with enough energy to melt whatever it is they smash into. Some of that molten material will form these beads, which may then be scattered widely by further impacts. The composition of these beads can vary wildly, as they’re composed of either whatever smashed into the Moon or whatever was on the Moon that got smashed. So, the relative concentrations of different materials will be all over the map.
By contrast, any relatively recent volcanism on the Moon will be extremely rare, so is likely to be from a single site and have a single composition. And, conveniently, the Apollo missions already returned samples of volcanic lunar rocks, which provide a model for what that composition might look like. So, the challenge was one of sorting through the beads returned from the Chang’e-5 landing site, and figuring out which ones looked volcanic.
And it really was a challenge, as there were over 3,000 beads returned, and the vast majority of them would have originated in impacts.
As a first cutoff, the team behind the new work got rid of anything that had a mixed composition, such as unmelted material embedded in the bead, or obvious compositional variation. This took the 3,000 beads down to 764. Those remaining beads were then subject to a technique that could determine what chemicals were present. (The team used an electron probe microanalyzer, which bombards the sample with electrons and uses the photons that are emitted to determine what elements are present.) As expected, compositions were all over the map. Some beads were less than 1 percent magnesium oxide; others nearly 30 percent. Silicon dioxide ranged from 16 to 60 percent.
Based on the Apollo samples, the researchers selected for beads that were high in magnesium oxide relative to calcium and aluminum oxides. That got them down to 13 potentially volcanic samples. They also looked for low nickel, as that’s found in many impactors, which got the number down to six. The final step was to look at sulfur isotopes, as impact melting tends to preferentially release the lighter isotope, altering the ratio compared to intact lunar rocks.
After all that, the researchers were left with three of the glassy beads, which is a big step down from the 3,000 they started with.
Erupted
Those three were then used to perform uranium-based radioactive dating, and they all produced numbers that were relatively close to each other. Based on the overlapping uncertainties, the researchers conclude that all were the product of an eruption that took place about 123 million years ago, give or take 15 million years. Considering that the most recent confirmed eruptions were about 2 billion years ago, that’s a major step forward in timing.
And that’s quite a bit of a surprise, as the Moon has had plenty of time to cool, and that cooling would have increased the distance between its surface and any molten material left in the interior. So it’s not obvious what could be creating sufficient heating to generate molten material at present. The researchers note that the Moon has a lot of material called KREEP (potassium, rare earth elements, phosphorus) that is high in radioactive isotopes and might lead to localized heating in some circumstances.
Unfortunately, it will be tough to associate this with any local geology, since there’s no indication of where the eruption occurred. Material this small can travel quite a distance in the Moon’s weak gravitational field and then could be scattered even farther by impacts. So, it’s possible that these belong to features that have been identified as potentially volcanic through orbital images.
In the meantime, the increased exploration of the Moon planned for the next few decades should get us more opportunities to see whether similar materials are widespread on the lunar surface. Eventually, that might potentially allow us to identify an area with higher concentrations of volcanic material than one particle in a thousand.


