Earth science

how-old-is-the-earliest-trace-of-life-on-earth?

How old is the earliest trace of life on Earth?


A recent conference sees doubts raised about the age of the oldest signs of life.

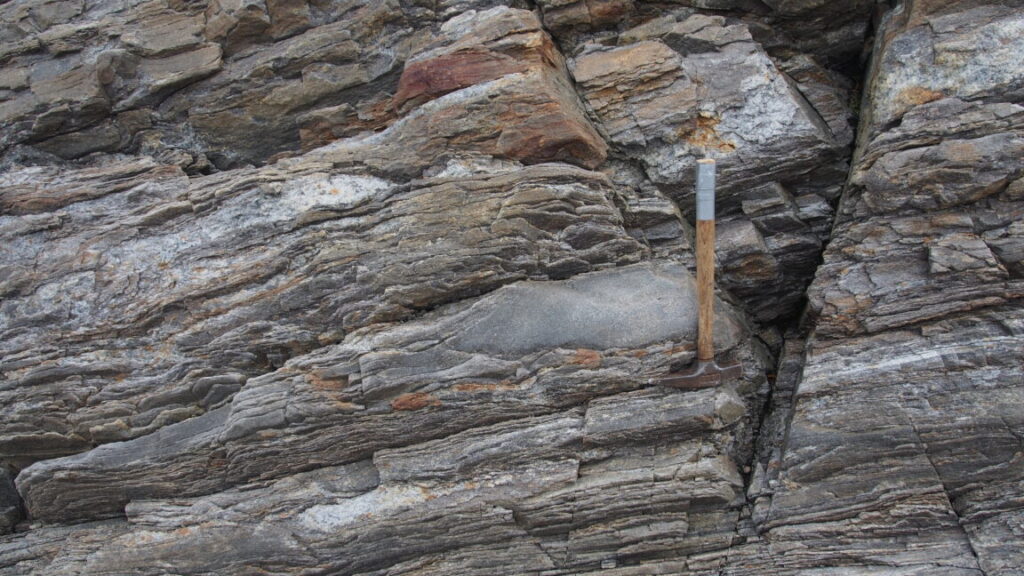
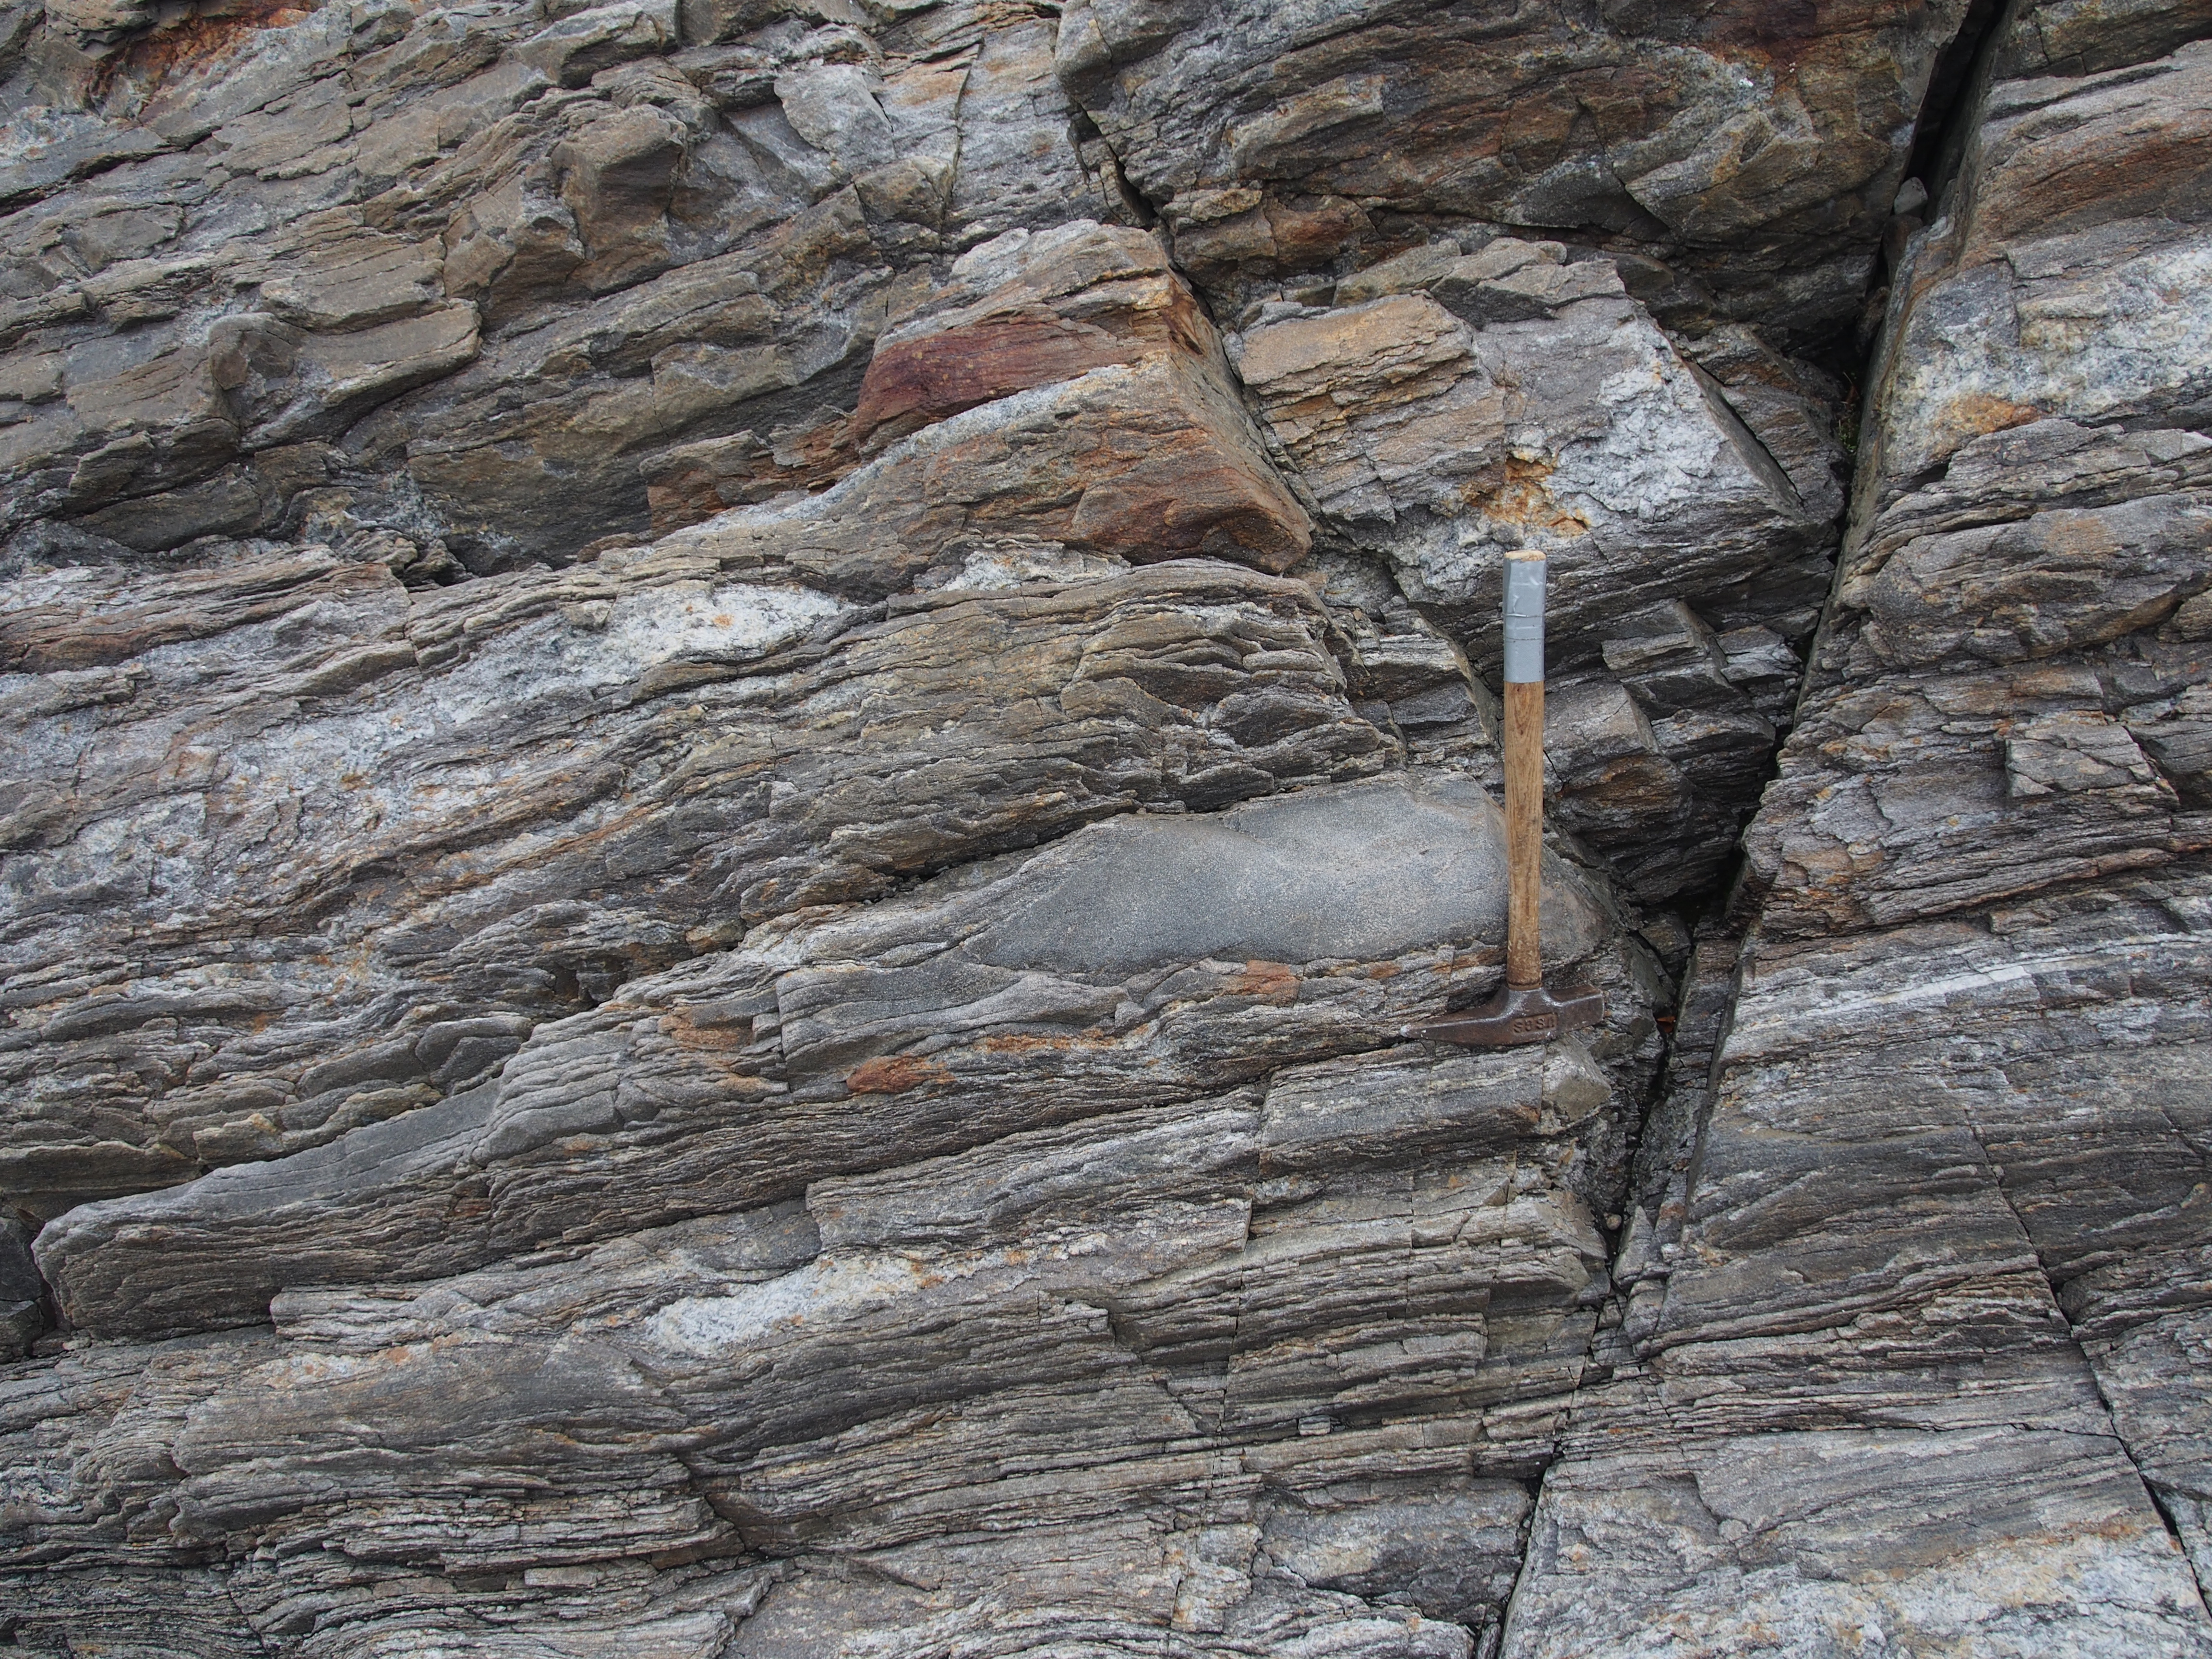
Where the microbe bodies are buried: metamorphosed sediments in Labrador, Canada containing microscopic traces of carbon. Credit: Martin Whitehouse

Where the microbe bodies are buried: metamorphosed sediments in Labrador, Canada containing microscopic traces of carbon. Credit: Martin Whitehouse

The question of when life began on Earth is as old as human culture.

“It’s one of these fundamental human questions: When did life appear on Earth?” said Professor Martin Whitehouse of the Swedish Museum of Natural History.

So when some apparently biological carbon was dated to at least 3.95 billion years ago—making it the oldest remains of life on Earth—the claim sparked interest and skepticism in equal measure, as Ars Technica reported in 2017.

Whitehouse was among those skeptics. This July, he presented new evidence to the Goldschmidt Conference in Prague that the carbon in question is only between 2.7–2.8 billion years old, making it younger than other traces of life found elsewhere.

Organic carbon?

The carbon in question is in rock in Labrador, Canada. The rock was originally silt on the seafloor that, it’s argued, hosted early microbial life that was buried by more silt, leaving the carbon as their remains. The pressure and heat of deep burial and tectonic events over eons have transformed the silt into a hard metamorphic rock, and the microbial carbon in it has metamorphosed into graphite.

“They are very tiny, little graphite bits,” said Whitehouse.

The key to showing that this graphite was originally biological versus geological is its carbon isotope ratio. From life’s earliest days, its enzymes have preferred the slightly lighter isotope carbon-12 over the marginally heavier carbon-13. Organic carbon is therefore much richer in carbon-12 than geological carbon, and the Labrador graphite does indeed have this “light” biological isotope signature.

The key question, however, is its true age.

Mixed-up, muddled-up, shook-up rocks

Sorting out the age of the carbon-containing Labrador rock is a geological can of worms.

These are some of the oldest rocks on the planet—they’ve been heated, squished, melted, and faulted multiple times as Earth went through the growth, collision, and breakup of continents before being worn down by ice and exposed today.

“That rock itself is unbelievably complicated,” said Whitehouse. “It’s been through multiple phases of deformation.”

In general, the only ways to date sediments are if there’s a layer of volcanic ash in them, or by distinctive fossils in the sediments. Neither is available in these Labrador rocks.

“The rock itself is not directly dateable,” said Whitehouse, “so then you fall onto the next best thing, which is you want to look for a classic field geology cross-cutting relationship of something that is younger and something that you can date.”

The idea, which is as old as the science of geology itself, is to bracket the age of the sediment by finding a rock formation that cuts across it. Logically, the cross-cutting rock is younger than the sediment it cuts across.

In this case, the carbon-containing metamorphosed siltstone is surrounded by swirly, gray banded gneiss rock, but the boundary between the siltstone and the gray gneiss is parallel, so there’s no cross-cutting to use.

Professor Tsuyoshi Komiya of The University of Tokyo was a coauthor on the 3.95 billion-year age paper. His team used a cross-cutting rock they found at a different location and extrapolated that to the carbon-bearing siltstone to constrain its age. “It was discovered that the gneiss was intruded into supracrustal rocks (mafic and sedimentary rocks),” said Komiya in an email to Ars Technica.

But Whitehouse disputes that inference between the different outcrops.

“You’re reliant upon making these very long-distance assumptions and correlations to try to date something that might actually not have anything to do with what you think you’re dating,” he said.

Professor Jonathan O’Neil of the University of Ottawa, who was not involved in either Whitehouse’s or Komiya’s studies but who has visited the outcrops in question, agrees with Whitehouse. “I remember I was not convinced either by these cross-cutting relationships,” he told Ars. “It’s not clear to me that one is necessarily older than the other.”

With the field geology evidence disputed, the other pillar holding up the 3.95-billion-year-old date is its radiometric date, measured in zircon crystals extracted from the rocks surrounding the metamorphosed siltstone.

The zircon keeps the score

Geologists use the mineral zircon to date rocks because when it crystallizes, it incorporates uranium but not lead. So as radioactive uranium slowly decays into lead, the ratio of uranium to lead provides the age of the crystal.

But the trouble with any date obtained from rocks as complicated as these is knowing exactly what geological event it dates—the number alone means little without the context of all the other geological evidence for the events that affected the area.

Both Whitehouse and O’Neil have independently sampled and dated the same rocks as Komiya’s team, and where Komiya’s team got a date of 3.95, Whitehouse’s and O’Neil’s new dates are both around 3.87 billion years. Importantly, O’Neil’s and Whitehouse’s dates are far more precise, with errors around plus-or-minus 5 or 6 million years, which is remarkably precise for dates in rocks this old. The 3.95 date had an error around 10 times bigger. “It’s a large error,” said O’Neil.

But there’s a more important question: How is that date related to the age of the organic carbon? The rocks have been through many events that could each have “set” the dates in the zircons. That’s because zircons can survive multiple re-heatings and even partial remelting, with each new event adding a new layer, or “zone,” on the outer surface of the crystal, recording the age of that event.

“This rock has seen all the events, and the zircon in it has responded to all of these events in a way that, when you go in with a very small-scale ion beam to do the sampling on these different zones, you can pick apart the geological history,” Whitehouse said.

Whitehouse’s team zapped tiny spots on the zircons with a beam of negatively charged oxygen ions to dislodge ions from the crystals, then sucked away these ions into a mass spectrometer to measure the uranium-lead ratio, and thus the dates. The tiny beam and relatively small error have allowed Whitehouse to document the events that these rocks have been through.

“Having our own zircon means we’ve been able to go in and look in more detail at the internal structure in the zircon,” said Whitehouse. “Where we might have a core that’s 3.87, we’ll have a rim that is 2.7 billion years, and that rim, morphologically, looks like an igneous zircon,” said Whitehouse.

That igneous outer rim of Whitehouse’s zircons shows that it formed in partially molten rock that would have flowed at that time. That flow was probably what brought it next to the carbon-containing sediments. Its date of 2.7 billion years ago means the carbon in the sediments could be any age older than that.

That’s a key difference from Komiya’s work. He argues that the older dates in the cores of the zircons are the true age of the cross-cutting rock. “Even the igneous zircons must have been affected by the tectonothermal event; therefore, the obtained age is the minimum age, and the true age is older,” said Komiya. “The fact that young zircons were found does not negate our research.”

But Whitehouse contends that the old cores of the zircons instead record a time when the original rock formed, long before it became a gneiss and flowed next to the carbon-bearing sediments.

Zombie crystals

Zircon’s resilience means it can survive being eroded from the rock where it formed and then deposited in a new, sedimentary rock as the undead remnants of an older, now-vanished landscape.

The carbon-containing siltstone contains zombie zircons, and Whitehouse presented new data on them to the Goldschmidt Conference, dating them to 2.8 billion years ago. Whitehouse argues that these crystals formed in an igneous rock 2.8 billion years ago and then were eroded, washed into the sea, and settled in the silt. So the siltstone must be no older than 2.8 billion years old, he said.

“You cannot deposit a zircon that is not formed yet,” O’Neil explained.

greyscale image of tiny fragments of mineral, with multiple layers visible in each fragment. A number of sites are circled on each fragment.

Tiny recorders of history – ancient zircon crystals from Labrador. Left shows layers built up as the zircon went through many heating events. Right shows a zircon with a prism-like outer shape showing that it formed in igneous conditions around an earlier zircon. Circles indicate where an ion beam was used to measure dates. Credit: Martin Whitehouse

This 2.8-billion-year age, along with the igneous zircon age of 2.7 billion years, brackets the age of the organic carbon to anywhere between 2.8 and 2.7 billion years old. That’s much younger than Komiya’s date of 3.95 billion years old.

Komiya disagrees: “I think that the estimated age is minimum age because zircons suffered from many thermal events, so that they were rejuvenated,” he said. In other words, the 2.8-billion-year age again reflects later heating, and the true date is given by the oldest-dated zircons in the siltstone.

But Whitehouse presented a third line of evidence to dispute the 3.95-billion-year date: isotopes of hafnium in the same zombie zircon crystals.

The technique relies on radioactive decay of lutetium-176 to hafnium-176. If the 2.8-billion-year age resulted from rejuvenation by later heating, it would have had to have formed from material with a hafnium isotope ratio incompatible with the isotope composition of the early Earth.

“They go to impossible numbers,” said Whitehouse.

The only way that the uranium-lead ratio can be compatible with the hafnium in the zircons, Whitehouse argued, is if the zircons that settled in the silt had crystallized around 2.8 billion years ago, constraining the organic carbon to being no older than that.

The new oldest remains of life on Earth, for now

If the Labrador carbon is no longer the oldest trace of life on Earth, then where are the oldest remains of life now?

For Whitehouse, it’s in the 3.77-billion-year-old Isua Greenstone Belt in Greenland: “I’m willing to believe that’s a well-documented age… that’s what I think is the best evidence for the oldest biogenicity that we have,” said Whitehouse.

O’Neil recently co-authored a paper on Earth’s oldest surviving crustal rocks, located next to Hudson Bay in Canada. He points there. “I would say it’s in the Nuvvuagittuq Greenstone belt,” said O’Neil, “because I would argue that these rocks are 4.3 billion years old. Again, not everybody agrees!” Intriguingly, the rocks he is referring to contain carbon with a possibly biological origin and are thought to be the remains of the kind of undersea vent where life could well have first emerged.

But the bigger picture is the fact that we have credible traces of life of this vintage—be it 3.8 or 3.9 or 4.3 billion years.

Any of those dates is remarkably early in the planet’s 4.6-billion-year life. It’s long before there was an oxygenated atmosphere, before continents emerged above sea level, and before plate tectonics got going. It’s also much older than the oldest microbial “stromatolite” fossils, which have been dated to about 3.48 billion years ago.

O’Neil thinks that once conditions on Earth were habitable, life would have emerged relatively fast: “To me, it’s not shocking, because the conditions were the same,” he said. “The Earth has the luxury of time… but biology is very quick. So if all the conditions were there by 4.3 billion years old, why would biology wait 500 million years to start?”

Photo of Howard Lee

Howard Lee is a freelance science writer focusing on the evolution of planet Earth through deep time. He earned a B.Sc. in geology and M.Sc. in remote sensing, both from the University of London, UK.

How old is the earliest trace of life on Earth? Read More »

analysis:-the-trump-administration’s-assault-on-climate-action

Analysis: The Trump administration’s assault on climate action


Official actions don’t challenge science, while unofficial docs muddy the waters.

Last week, the Environmental Protection Agency made lots of headlines by rejecting the document that establishes its ability to regulate the greenhouse gases that are warming our climate. While the legal assault on regulations grabbed most of the attention, it was paired with two other actions that targeted other aspects of climate change: the science underlying our current understanding of the dramatic warming the Earth is experiencing, and the renewable energy that represents our best chance of limiting this warming.

Collectively, these actions illuminate the administration’s strategy for dealing with a problem that it would prefer to believe doesn’t exist, despite our extensive documentation of its reality. They also show how the administration is tailoring its approach to different audiences, including the audience of one who is demanding inaction.

When in doubt, make something up

The simplest thing to understand is an action by the Department of the Interior, which handles permitting for energy projects on federal land—including wind and solar, both onshore and off. That has placed the Interior in an awkward position. Wind and solar are now generally the cheapest ways to generate electricity and are currently in the process of a spectacular boom, with solar now accounting for over 80 percent of the newly installed capacity in the US.

Yet, when Trump issued an executive order declaring an energy emergency, wind and solar were notably excluded as potential solutions. Language from Trump and other administration officials has also made it clear that renewable energy is viewed as an impediment to the administration’s pro-fossil fuel agenda.

But shutting down federal permitting for renewable energy with little more than “we don’t like it” as justification could run afoul of rules that forbid government decisions from being “arbitrary and capricious.” This may explain why the government gave up on its attempts to block the ongoing construction of an offshore wind farm in New York waters.

On Friday, the Interior announced that it had settled on a less arbitrary justification for blocking renewable energy on public land: energy density. Given a metric of land use per megawatt, wind and solar are less efficient than nuclear plants we can’t manage to build on time or budget, and therefore “environmentally damaging” and an inefficient use of federal land, according to the new logic. “The Department will now consider proposed energy project’s capacity density when assessing the project’s potential energy benefits to the nation and impacts to the environment and wildlife,” Interior declared.

This is only marginally more reasonable than Interior Secretary Doug Burgum’s apparent inability to recognize that solar power can be stored in batteries. But it has three features that will be recurring themes. There’s at least a token attempt to provide a justification that might survive the inevitable lawsuits, while at the same time providing fodder for the culture war that many in the administration demand. And it avoids directly attacking the science that initially motivated the push toward renewables.

Energy vs. the climate

That’s not to say that climate change isn’t in for attack. It’s just that the attacks are being strategically separated from the decisions that might produce a lawsuit. Last week, the burden of taking on extremely well-understood and supported science fell to the Department of Energy, which released a report on climate “science” to coincide with the EPA’s decision to give up on attempts to regulate greenhouse gases.

For those who have followed public debates over climate change, looking at the author list—John Christy, Judith Curry, Steven Koonin, Ross McKitrick, and Roy Spencer—will give you a very clear picture of what to expect. Spencer is a creationist, raising questions about his ability to evaluate any science free from his personal biases. (He has also said, “My job has helped save our economy from the economic ravages of out-of-control environmental extremism,” so it’s not just biology where he’s got these issues.) McKitrick is an economist who engaged in a multi-year attempt to raise doubt about the prominent “hockey stick” reconstruction of past climates, even as scientists were replicating the results. Etc.

The report is a master class in arbitrary and capricious decision-making applied to science. Sometimes the authors rely on the peer-reviewed literature. Other times they perform their own analysis for this document, in some cases coming up with almost comically random metrics for data. (Example: “We examine occurrences of 5-day deluges as follows. Taking the Pacific coast as an example, a 130-year span contains 26 5-year intervals. At each location we computed the 5-day precipitation totals throughout the year and selected the 26 highest values across the sample.” Why five days? Five-year intervals? Who knows.)

This is especially striking in a few cases where the authors choose references that were published a few years ago, and thus neatly avoid the dramatic temperature records that have been set over the past couple of years. Similarly, they sometimes use regional measures and sometimes use global ones. They demand long-term data in some contexts, while getting excited about two years of coral growth in the Great Barrier Reef. The authors highlight the fact that US tide gauges don’t show any indication of an acceleration in the rate of sea level rise while ignoring the fact that global satellite measures clearly do.

That’s not to say that there aren’t other problems. There’s some blatant misinformation, like claims that urbanization could be distorting the warming, which has already been tested extensively. (Notably, warming is most intense in the sparsely populated Arctic.) There’s also some creative use of language, like referring to the ocean acidification caused by CO2 as “neutralizing ocean alkalinity.”

But the biggest bit of misinformation comes in the introduction, where the secretary of energy, Chris Wright, said of the authors, “I chose them for their rigor, honesty, and willingness to elevate the debate.” There is no reason to choose this group of marginal contrarians except the knowledge that they’d produce a report like this, thus providing a justification for those in the administration who want to believe it’s all a scam.

No science needed

The critical feature of the Department of Energy report is that it contains no policy actions; it’s purely about trying to undercut well-understood climate science. This means the questionable analyses in the report shouldn’t ever end up being tested in court.

That’s in contrast to the decision to withdraw the EPA’s endangerment finding regarding greenhouse gases. There’s quite an extensive history to the endangerment finding, but briefly, it’s the product of a Supreme Court decision (Massachusetts v. EPA), which compelled the EPA to evaluate whether greenhouse gases posed a threat to the US population as defined in the Clean Air Act. Both the Bush and Obama EPAs did so, thus enabling the regulation of greenhouse gases, including carbon dioxide.

Despite the claims in the Department of Energy report, there is comprehensive evidence that greenhouse gases are causing problems in the US, ranging from extreme weather to sea level rise. So while the EPA mentions the Department of Energy’s work a number of times, the actual action being taken skips over the science and focuses on legal issues. In doing so, it creates a false history where the endangerment finding had no legal foundation.

To re-recap, the Supreme Court determined that this evaluation was required by the Clean Air Act. George W. Bush’s administration performed the analysis and reached the exact same conclusion as the Obama administration (though the former chose to ignore those conclusions). Yet Trump’s EPA is calling the endangerment finding “an unprecedented move” by the Obama administration that involved “mental leaps” and “ignored Congress’ clear intent.” And the EPA presents the findings as strategic, “the only way the Obama-Biden Administration could access EPA’s authority to regulate,” rather than compelled by scientific evidence.

Fundamentally, it’s an ahistorical presentation; the EPA is counting on nobody remembering what actually happened.

The announcement doesn’t get much better when it comes to the future. The only immediate change will be an end to any attempts to regulate carbon emissions from motor vehicles, since regulations for power plants had been on hold due to court challenges. Yet somehow, the EPA’s statement claims that this absence of regulation imposed costs on people. “The Endangerment Finding has also played a significant role in EPA’s justification of regulations of other sources beyond cars and trucks, resulting in additional costly burdens on American families and businesses,” it said.

We’re still endangered

Overall, the announcements made last week provide a clear picture of how the administration intends to avoid addressing climate change and cripple the responses started by previous administrations. Outside of the policy arena, it will question the science and use partisan misinformation to rally its supporters for the fight. But it recognizes that these approaches aren’t flying when it comes to the courts.

So it will separately pursue a legal approach that seeks to undercut the ability of anyone, including private businesses, to address climate change, crafting “reasons” for its decisions in a way that might survive legal challenge—because these actions are almost certain to be challenged in court. And that may be the ultimate goal. The current court has shown a near-complete disinterest in respecting precedent and has issued a string of decisions that severely limit the EPA. It’s quite possible that the court will simply throw out the prior decision that compelled the government to issue an endangerment finding in the first place.

If that’s left in place, then any ensuing administrations can simply issue a new endangerment finding. If anything, the effects of climate change on the US population have become more obvious, and the scientific understanding of human-driven warming has solidified since the Bush administration first acknowledged them.

Photo of John Timmer

John is Ars Technica’s science editor. He has a Bachelor of Arts in Biochemistry from Columbia University, and a Ph.D. in Molecular and Cell Biology from the University of California, Berkeley. When physically separated from his keyboard, he tends to seek out a bicycle, or a scenic location for communing with his hiking boots.

Analysis: The Trump administration’s assault on climate action Read More »

ars-live-recap:-climate-science-in-a-rapidly-changing-world

Ars Live recap: Climate science in a rapidly changing world

The conversation then moved to the record we have of the Earth’s surface temperatures and the role of Berkeley Earth in providing an alternate method of calculating those. While the temperature records were somewhat controversial in the past, those arguments have largely settled down, and Berkeley Earth played a major role in helping to show that the temperature records have been reliable.

Lately, those temperatures have been unusually high, crossing 1.5° C above pre-industrial conditions for the first time and remaining elevated for months at a stretch. Scientists have been coming up with a number of explanations and figuring out how to test them. Hausfather described those tests and what we’re learning about how these things might be influencing the trajectory of our warming.

From there, we moved on to user questions, which addressed issues like tipping points, the potential use of geoengineering, and what things Hausfather would most like to see in terms of better data and new questions to answer. For details on these issues and the answers to viewer questions, see the video above. We also have a full transcript of the conversation.

Ars Live recap: Climate science in a rapidly changing world Read More »

what-the-epa’s-“endangerment-finding”-is-and-why-it’s-being-challenged

What the EPA’s “endangerment finding” is and why it’s being challenged


Getting rid of the justification for greenhouse gas regulations won’t be easy.

Credit: Mario Tama/Getty Images

A document that was first issued in 2009 would seem an unlikely candidate for making news in 2025. Yet the past few weeks have seen a steady stream of articles about an analysis first issued by the Environmental Protection Agency (EPA) in the early years of Obama’s first term: the endangerment finding on greenhouse gases.

The basics of the document are almost mundane: Greenhouse gases are warming the climate, and this will have negative consequences for US citizens. But it took a Supreme Court decision to get written in the first place, and it has played a role in every attempt by the EPA to regulate greenhouse gas emissions across multiple administrations. And, while the first Trump administration left it in place, the press reports we’re seeing suggest that an attempt will be made to eliminate it in the near future.

The only problem: The science in which the endangerment finding is based on is so solid that any ensuing court case will likely leave its opponents worse off in the long run, which is likely why the earlier Trump administration didn’t challenge it.

Get comfortable, because the story dates all the way back to the first Bush administration.

A bit of history

One of the goals of the US’s Clean Air Act, first passed in 1963, is to “address the public health and welfare risks posed by certain widespread air pollutants.” By the end of the last century, it was becoming increasingly clear that greenhouse gases fit that definition. While they weren’t necessarily directly harmful to the people inhaling them—our lungs are constantly being filled with carbon dioxide, after all—the downstream effects of the warming they caused could certainly impact human health and welfare. But, with the federal government taking no actions during George W. Bush’s time in office, a group of states and cities sued to force the EPA’s hand.

That suit eventually reached the Supreme Court in the form of Massachusetts v. EPA, which led to a ruling in 2007 determining that the Clean Air Act required the EPA to perform an analysis of the dangers posed by greenhouse gases. That analysis was done by late 2007, but the Bush administration simply ignored it for the remaining year it had in office. (It was eventually released after Bush left office.)

That left the Obama-era EPA to reach essentially the same conclusions that the Bush administration had: greenhouse gases are warming the planet. And that will have various impacts—sea-level rise, dangerous heat, damage to agriculture and forestry, and more.

That conclusion compelled the EPA to formulate regulations to limit the emission of greenhouse gases from power plants. Obama’s EPA did just that, but came late enough to still be tied up in courts by the time his term ended. The regulations were also formulated before the plunge in the cost of renewable power sources, which have since led to a drop in carbon emissions that have far outpaced what the EPA’s rules intended to accomplish.

The first Trump administration formulated alternative rules that also ended up in court for being an insufficient response to the conclusions of the endangerment finding, which ultimately led the Biden administration to start formulating a new set of rules. And at that point, the Supreme Court decided to step in and rule on the Obama rules, even though everyone knew they would never go into effect.

The court indicated that the EPA needed to regulate each power plant individually, rather than regulating the wider grid, which sent the Biden administration back to the drawing board. Its attempts at crafting regulations were also in court when Trump returned to office.

There were a couple of notable aspects to that last case, West Virginia v. EPA, which hinged on the fact that Congress had never explicitly indicated that it wanted to see greenhouse gases regulated. Congress responded by ensuring that the Inflation Reduction Act’s energy-focused components specifically mentioned that these were intended to limit carbon emissions, eliminating one potential roadblock. The other thing is that, in this and other court cases, the Supreme Court could have simply overturned Massachusetts v. EPA, the case that put greenhouse gases within the regulatory framework of the Clean Air Act. Yet a court that has shown a great enthusiasm for overturning precedent didn’t do so.

Nothing dangerous?

So, in the 15 years since the EPA initially released its endangerment findings, they’ve resulted in no regulations whatsoever. But, as long as they existed, the EPA is required to at least attempt to regulate them. So, getting rid of the endangerment findings would seem like the obvious thing for an administration led by a president who repeatedly calls climate change a hoax. And there were figures within the first Trump administration who argued in favor of that.

So why didn’t it happen?

That was never clear, but I’d suggest at least some members of the first Trump administration were realistic about the likely results. The effort to contest the endangerment finding was pushed by people who largely reject the vast body of scientific evidence that indicates that greenhouse gases are warming the climate. And, if anything, the evidence had gotten more decisive in the years between the initial endangerment finding and Trump’s inauguration. I expect that their effort was blocked by people who knew that it would fail in the courts and likely leave behind precedents that made future regulatory efforts easier.

This interpretation is supported by the fact that the Trump-era EPA received a number of formal petitions to revisit the endangerment finding. Having read a few (something you should not do), they are uniformly awful. References to supposed peer-reviewed “papers” turn out to be little more than PDFs hosted on a WordPress site. Other arguments are based on information contained in the proceedings of a conference organized by an anti-science think tank. The Trump administration rejected them all with minimal comment the day before Biden’s inauguration.

Biden’s EPA went back and made detailed criticisms of each of them if you want to see just how laughable the arguments against mainstream science were at the time. And, since then, we’ve experienced a few years of temperatures that are so high they’ve surprised many climate scientists.

Unrealistic

But the new head of the EPA is apparently anything but a realist, and multiple reports have indicated he’s asking to be given the opportunity to go ahead and redo the endangerment finding. A more recent report suggests two possibilities. One is to recruit scientists from the fringes to produce a misleading report and roll the dice on getting a sympathetic judge who will overlook the obvious flaws. The other would be to argue that any climate change that happens will have net benefits to the US.

That latter approach would run into the problem that we’ve gotten increasingly sophisticated at doing analyses that attribute the impact of climate change on the individual weather disasters that do harm the welfare of citizens of the US. While it might have been possible to make a case for uncertainty here a decade ago, that window has been largely closed by the scientific community.

Even if all of these efforts fail, it will be entirely possible for the EPA to construct greenhouse gas regulations that accomplish nothing and get tied up in court for the remainder of Trump’s term. But a court case could show just how laughably bad the positions staked out by climate contrarians are (and, by extension, the position of the president himself). There’s a small chance that the resulting court cases will result in a legal record that will make it that much harder to accept the sorts of minimalist regulations that Trump proposed in his first term.

Which is probably why this approach was rejected the first time around.

Photo of John Timmer

John is Ars Technica’s science editor. He has a Bachelor of Arts in Biochemistry from Columbia University, and a Ph.D. in Molecular and Cell Biology from the University of California, Berkeley. When physically separated from his keyboard, he tends to seek out a bicycle, or a scenic location for communing with his hiking boots.

What the EPA’s “endangerment finding” is and why it’s being challenged Read More »

everyone-agrees:-2024-the-hottest-year-since-the-thermometer-was-invented

Everyone agrees: 2024 the hottest year since the thermometer was invented


An exceptionally hot outlier, 2024 means the streak of hottest years goes to 11.

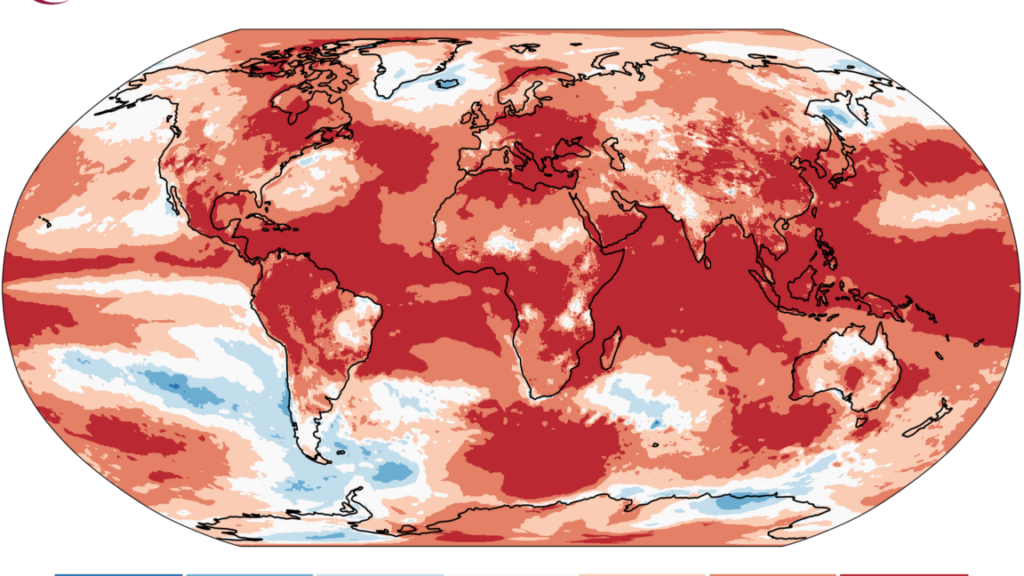
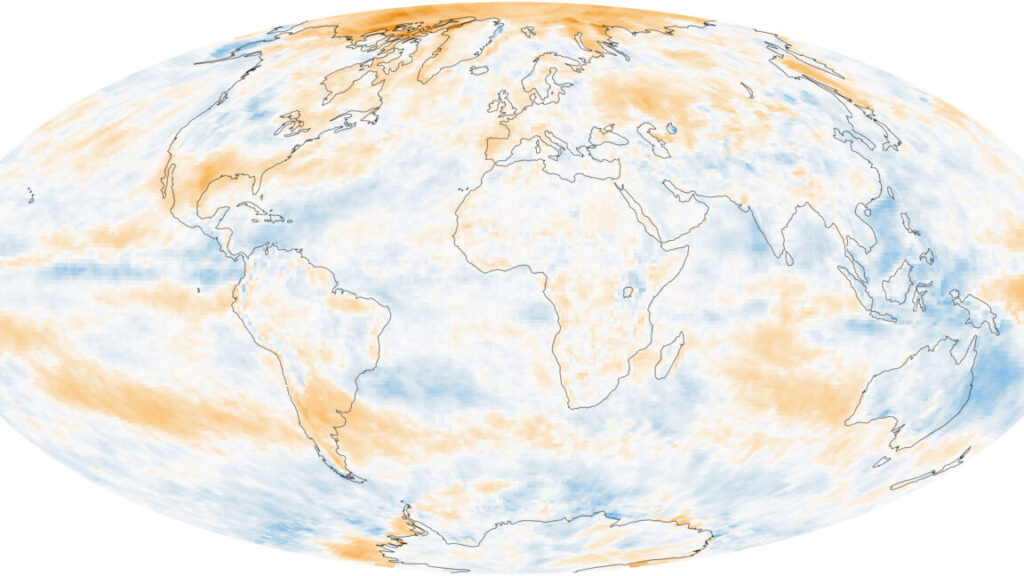
With very few and very small exceptions, 2024 was unusually hot across the globe. Credit: Copernicus

Over the last 24 hours or so, the major organizations that keep track of global temperatures have released figures for 2024, and all of them agree: 2024 was the warmest year yet recorded, joining 2023 as an unusual outlier in terms of how rapidly things heated up. At least two of the organizations, the European Union’s Copernicus and Berkeley Earth, place the year at about 1.6° C above pre-industrial temperatures, marking the first time that the Paris Agreement goal of limiting warming to 1.5° has been exceeded.

NASA and the National Oceanic and Atmospheric Administration both place the mark at slightly below 1.5° C over pre-industrial temperatures (as defined by the 1850–1900 average). However, that difference largely reflects the uncertainties in measuring temperatures during that period rather than disagreement over 2024.

It’s hot everywhere

2023 had set a temperature record largely due to a switch to El Niño conditions midway through the year, which made the second half of the year exceptionally hot. It takes some time for that heat to make its way from the ocean into the atmosphere, so the streak of warm months continued into 2024, even as the Pacific switched into its cooler La Niña mode.

While El Niños are regular events, this one had an outsized impact because it was accompanied by unusually warm temperatures outside the Pacific, including record high temperatures in the Atlantic and unusual warmth in the Indian Ocean. Land temperatures reflect this widespread warmth, with elevated temperatures on all continents. Berkeley Earth estimates that 104 countries registered 2024 as the warmest on record, meaning 3.3 billion people felt the hottest average temperatures they had ever experienced.

Different organizations use slightly different methods to calculate the global temperature and have different baselines. For example, Copernicus puts 2024 at 0.72° C above a baseline that will be familiar to many people since they were alive for it: 1991 to 2000. In contrast, NASA and NOAA use a baseline that covers the entirety of the last century, which is substantially cooler overall. Relative to that baseline, 2024 is 1.29° C warmer.

Lining up the baselines shows that these different services largely agree with each other, with most of the differences due to uncertainties in the measurements, with the rest accounted for by slightly different methods of handling things like areas with sparse data.

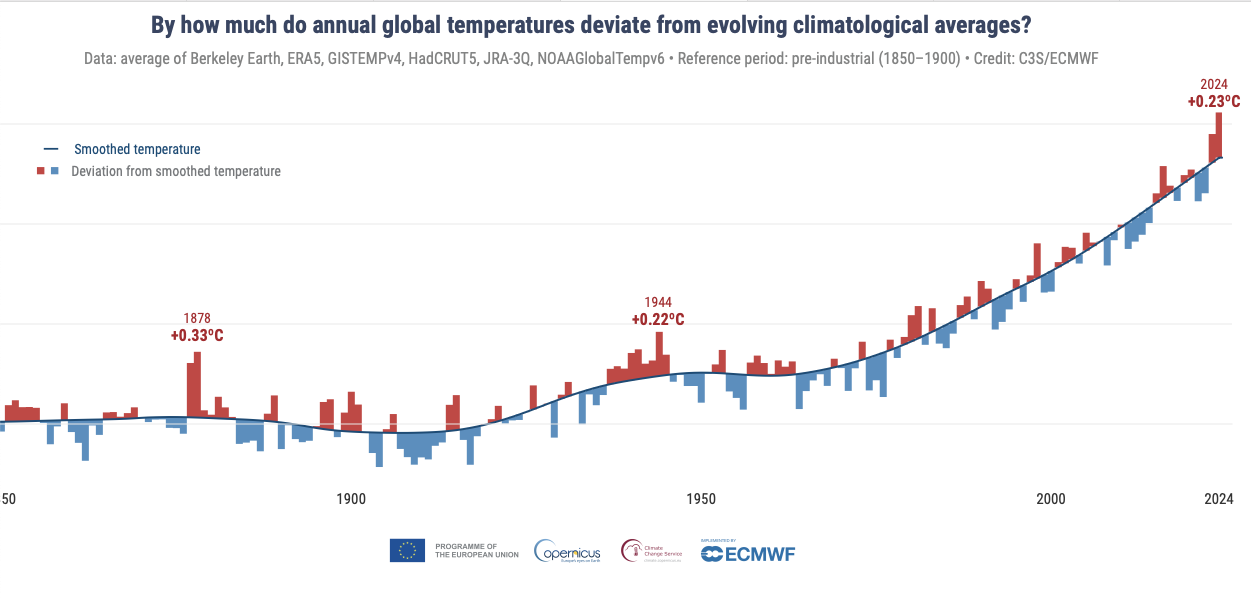
Describing the details of 2024, however, doesn’t really capture just how exceptional the warmth of the last two years has been. Starting in around 1970, there’s been a roughly linear increase in temperature driven by greenhouse gas emissions, despite many individual years that were warmer or cooler than the trend. The last two years have been extreme outliers from this trend. The last time there was a single comparable year to 2024 was back in the 1940s. The last time there were two consecutive years like this was in 1878.

A graph showing a curve that increases smoothly from left to right, with individual points on the curve hosting red and blue lines above and below. The red line at 2024 is larger than any since 1978.

Relative to the five-year temperature average, 2024 is an exceptionally large excursion. Credit: Copernicus

“These were during the ‘Great Drought’ of 1875 to 1878, when it is estimated that around 50 million people died in India, China, and parts of Africa and South America,” the EU’s Copernicus service notes. Despite many climate-driven disasters, the world at least avoided a similar experience in 2023-24.

Berkeley Earth provides a slightly different way of looking at it, comparing each year since 1970 with the amount of warming we’d expect from the cumulative greenhouse gas emissions.

A graph showing a reddish wedge, growing from left to right. A black line traces the annual temperatures, which over near the top edge of the wedge until recent years.

Relative to the expected warming from greenhouse gasses, 2024 represents a large departure. Credit: Berkeley Earth

These show that, given year-to-year variations in the climate system, warming has closely tracked expectations over five decades. 2023 and 2024 mark a dramatic departure from that track, although it comes at the end of a decade where most years were above the trend line. Berkeley Earth estimates that there’s just a 1 in 100 chance of that occurring due to the climate’s internal variability.

Is this a new trend?

The big question is whether 2024 is an exception and we should expect things to fall back to the trend that’s dominated since the 1970s, or it marks a departure from the climate’s recent behavior. And that’s something we don’t have a great answer to.

If you take away the influence of recent greenhouse gas emissions and El Niño, you can focus on other potential factors. These include a slight increase expected due to the solar cycle approaching its maximum activity. But, beyond that, most of the other factors are uncertain. The Hunga Tonga eruption put lots of water vapor into the stratosphere, but the estimated effects range from slight warming to cooling equivalent to a strong La Niña. Reductions in pollution from shipping are expected to contribute to warming, but the amount is debated.

There is evidence that a decrease in cloud cover has allowed more sunlight to be absorbed by the Earth, contributing to the planet’s warming. But clouds are typically a response to other factors that influence the climate, such as the amount of water vapor in the atmosphere and the aerosols present to seed water droplets.

It’s possible that a factor that we missed is driving the changes in cloud cover or that 2024 just saw the chaotic nature of the atmosphere result in less cloud cover. Alternatively, we may have crossed a warming tipping point, where the warmth of the atmosphere makes cloud formation less likely. Knowing that will be critical going forward, but we simply don’t have a good answer right now.

Climate goals

There’s an equally unsatisfying answer to what this means for our chance of hitting climate goals. The stretch goal of the Paris Agreement is to limit warming to 1.5° C, because it leads to significantly less severe impacts than the primary, 2.0° target. That’s relative to pre-industrial temperatures, which are defined using the 1850–1900 period, the earliest time where temperature records allow a reconstruction of the global temperature.

Unfortunately, all the organizations that handle global temperatures have some differences in the analysis methods and data used. Given recent data, these differences result in very small divergences in the estimated global temperatures. But with the far larger uncertainties in the 1850–1900 data, they tend to diverge more dramatically. As a result, each organization has a different baseline, and different anomalies relative to that.

As a result, Berkeley Earth registers 2024 as being 1.62° C above preindustrial temperatures, and Copernicus 1.60° C. In contrast, NASA and NOAA place it just under 1.5° C (1.47° and 1.46°, respectively). NASA’s Gavin Schmidt said this is “almost entirely due to the [sea surface temperature] data set being used” in constructing the temperature record.

There is, however, consensus that this isn’t especially meaningful on its own. There’s a good chance that temperatures will drop below the 1.5° mark on all the data sets within the next few years. We’ll want to see temperatures consistently exceed that mark for over a decade before we consider that we’ve passed the milestone.

That said, given that carbon emissions have barely budged in recent years, there’s little doubt that we will eventually end up clearly passing that limit (Berkeley Earth is essentially treating it as exceeded already). But there’s widespread agreement that each increment between 1.5° and 2.0° will likely increase the consequences of climate change, and any continuing emissions will make it harder to bring things back under that target in the future through methods like carbon capture and storage.

So, while we may have committed ourselves to exceed one of our major climate targets, that shouldn’t be viewed as a reason to stop trying to limit greenhouse gas emissions.

Photo of John Timmer

John is Ars Technica’s science editor. He has a Bachelor of Arts in Biochemistry from Columbia University, and a Ph.D. in Molecular and Cell Biology from the University of California, Berkeley. When physically separated from his keyboard, he tends to seek out a bicycle, or a scenic location for communing with his hiking boots.

Everyone agrees: 2024 the hottest year since the thermometer was invented Read More »

study:-warming-has-accelerated-due-to-the-earth-absorbing-more-sunlight

Study: Warming has accelerated due to the Earth absorbing more sunlight

The concept of an atmospheric energy imbalance is pretty straightforward: We can measure both the amount of energy the Earth receives from the Sun and how much energy it radiates back into space. Any difference between the two results in a net energy imbalance that’s either absorbed by or extracted from the ocean/atmosphere system. And we’ve been tracking it via satellite for a while now as rising greenhouse gas levels have gradually increased the imbalance.

But greenhouse gases aren’t the only thing having an effect. For example, the imbalance has also increased in the Arctic due to the loss of snow cover and retreat of sea ice. The dark ground and ocean absorb more solar energy compared to the white material that had previously been exposed to the sunlight. Not all of this is felt directly, however, as a lot of the areas where it’s happening are frequently covered by clouds.

Nevertheless, the loss of snow and ice has caused the Earth’s reflectivity, termed its albedo, to decline since the 1970s, enhancing the warming a bit.

Vanishing clouds

The new paper finds that the energy imbalance set a new high in 2023, with a record amount of energy being absorbed by the ocean/atmosphere system. This wasn’t accompanied by a drop in infrared emissions from the Earth, suggesting it wasn’t due to greenhouse gases, which trap heat by absorbing this radiation. Instead, it seems to be due to decreased reflection of incoming sunlight by the Earth.

While there was a general trend in that direction, the planet set a new record low for albedo in 2023. Using two different data sets, the teams identify the areas most effected by this, and they’re not at the poles, indicating loss of snow and ice are unlikely to be the cause. Instead, the key contributor appears to be the loss of low-level clouds. “The cloud-related albedo reduction is apparently largely due to a pronounced decline of low-level clouds over the northern mid-latitude and tropical oceans, in particular the Atlantic,” the researchers say.

Study: Warming has accelerated due to the Earth absorbing more sunlight Read More »

google’s-deepmind-tackles-weather-forecasting,-with-great-performance

Google’s DeepMind tackles weather forecasting, with great performance

By some measures, AI systems are now competitive with traditional computing methods for generating weather forecasts. Because their training penalizes errors, however, the forecasts tend to get “blurry”—as you move further ahead in time, the models make fewer specific predictions since those are more likely to be wrong. As a result, you start to see things like storm tracks broadening and the storms themselves losing clearly defined edges.

But using AI is still extremely tempting because the alternative is a computational atmospheric circulation model, which is extremely compute-intensive. Still, it’s highly successful, with the ensemble model from the European Centre for Medium-Range Weather Forecasts considered the best in class.

In a paper being released today, Google’s DeepMind claims its new AI system manages to outperform the European model on forecasts out to at least a week and often beyond. DeepMind’s system, called GenCast, merges some computational approaches used by atmospheric scientists with a diffusion model, commonly used in generative AI. The result is a system that maintains high resolution while cutting the computational cost significantly.

Ensemble forecasting

Traditional computational methods have two main advantages over AI systems. The first is that they’re directly based on atmospheric physics, incorporating the rules we know govern the behavior of our actual weather, and they calculate some of the details in a way that’s directly informed by empirical data. They’re also run as ensembles, meaning that multiple instances of the model are run. Due to the chaotic nature of the weather, these different runs will gradually diverge, providing a measure of the uncertainty of the forecast.

At least one attempt has been made to merge some of the aspects of traditional weather models with AI systems. An internal Google project used a traditional atmospheric circulation model that divided the Earth’s surface into a grid of cells but used an AI to predict the behavior of each cell. This provided much better computational performance, but at the expense of relatively large grid cells, which resulted in relatively low resolution.

For its take on AI weather predictions, DeepMind decided to skip the physics and instead adopt the ability to run an ensemble.

Gen Cast is based on diffusion models, which have a key feature that’s useful here. In essence, these models are trained by starting them with a mixture of an original—image, text, weather pattern—and then a variation where noise is injected. The system is supposed to create a variation of the noisy version that is closer to the original. Once trained, it can be fed pure noise and evolve the noise to be closer to whatever it’s targeting.

In this case, the target is realistic weather data, and the system takes an input of pure noise and evolves it based on the atmosphere’s current state and its recent history. For longer-range forecasts, the “history” includes both the actual data and the predicted data from earlier forecasts. The system moves forward in 12-hour steps, so the forecast for day three will incorporate the starting conditions, the earlier history, and the two forecasts from days one and two.

This is useful for creating an ensemble forecast because you can feed it different patterns of noise as input, and each will produce a slightly different output of weather data. This serves the same purpose it does in a traditional weather model: providing a measure of the uncertainty for the forecast.

For each grid square, GenCast works with six weather measures at the surface, along with six that track the state of the atmosphere and 13 different altitudes at which it estimates the air pressure. Each of these grid squares is 0.2 degrees on a side, a higher resolution than the European model uses for its forecasts. Despite that resolution, DeepMind estimates that a single instance (meaning not a full ensemble) can be run out to 15 days on one of Google’s tensor processing systems in just eight minutes.

It’s possible to make an ensemble forecast by running multiple versions of this in parallel and then integrating the results. Given the amount of hardware Google has at its disposal, the whole process from start to finish is likely to take less than 20 minutes. The source and training data will be placed on the GitHub page for DeepMind’s GraphCast project. Given the relatively low computational requirements, we can probably expect individual academic research teams to start experimenting with it.

Measures of success

DeepMind reports that GenCast dramatically outperforms the best traditional forecasting model. Using a standard benchmark in the field, DeepMind found that GenCast was more accurate than the European model on 97 percent of the tests it used, which checked different output values at different times in the future. In addition, the confidence values, based on the uncertainty obtained from the ensemble, were generally reasonable.

Past AI weather forecasters, having been trained on real-world data, are generally not great at handling extreme weather since it shows up so rarely in the training set. But GenCast did quite well, often outperforming the European model in things like abnormally high and low temperatures and air pressure (one percent frequency or less, including at the 0.01 percentile).

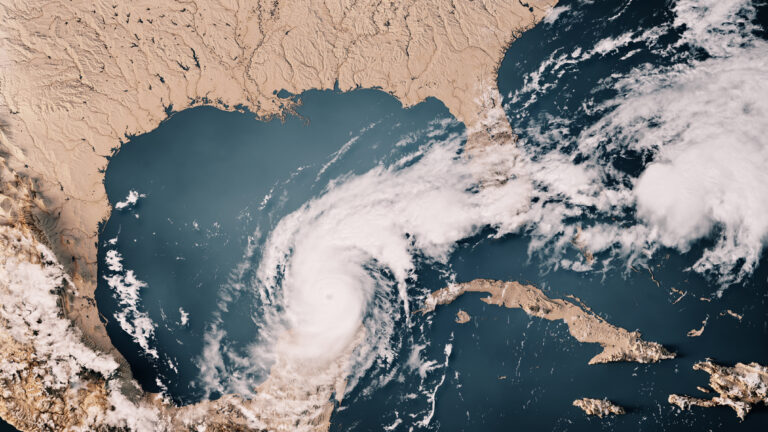
DeepMind also went beyond standard tests to determine whether GenCast might be useful. This research included projecting the tracks of tropical cyclones, an important job for forecasting models. For the first four days, GenCast was significantly more accurate than the European model, and it maintained its lead out to about a week.

One of DeepMind’s most interesting tests was checking the global forecast of wind power output based on information from the Global Powerplant Database. This involved using it to forecast wind speeds at 10 meters above the surface (which is actually lower than where most turbines reside but is the best approximation possible) and then using that number to figure out how much power would be generated. The system beat the traditional weather model by 20 percent for the first two days and stayed in front with a declining lead out to a week.

The researchers don’t spend much time examining why performance seems to decline gradually for about a week. Ideally, more details about GenCast’s limitations would help inform further improvements, so the researchers are likely thinking about it. In any case, today’s paper marks the second case where taking something akin to a hybrid approach—mixing aspects of traditional forecast systems with AI—has been reported to improve forecasts. And both those cases took very different approaches, raising the prospect that it will be possible to combine some of their features.

Nature, 2024. DOI: 10.1038/s41586-024-08252-9  (About DOIs).
Google’s DeepMind tackles weather forecasting, with great performance Read More »

a-how-to-for-ethical-geoengineering-research

A how-to for ethical geoengineering research

Holistic climate justice: The guidelines recognize that geoengineering won’t affect just those people currently residing on Earth, but on future generations as well. Some methods, like stratospheric aerosols, don’t eliminate the risks caused by warming, but shift them onto future generations, who will face sudden and potentially dramatic warming if the geoengineering is ever stopped. Others may cause regional differences in either benefits or warming, shifting consequences to different populations.

Special attention should be paid to those who have historically been on the wrong side of environmental problems in the past. And harms to nature need to be considered as well.

Inclusive public participation: The research shouldn’t be approached as simply a scientific process; instead, any affected communities should be included in the process, and informed consent should be obtained from them. There should be ongoing public engagement with those communities and adapt to their cultural values.

Transparency: The public needs to be aware of who’s funding any geoengineering research and ensure that whoever’s providing the money doesn’t influence decisions regarding the design of the research. Those decisions, and the considerations behind them, should also be made clear to the public.

Informed governance: Any experiments have to conform to laws ranging from local to international. Any research programs should be approved by an independent body before any work starts. All the parties involved—and this could include the funders, the institutions, and outside contractors—should be held accountable to governments, public institutions, and those who will potentially be impacted by the work.

If you think this will make pursuing this research considerably more complicated, you are absolutely correct. But again, even tests of these approaches could have serious environmental consequences. And many of these things represent best practices for any research with potential public consequences; the fact that they haven’t always been pursued is not an excuse to continue to avoid doing them.

A how-to for ethical geoengineering research Read More »

climate-change-boosted-milton’s-landfall-strength-from-category-2-to-3

Climate change boosted Milton’s landfall strength from Category 2 to 3

Using this simulated data set, called IRIS, the researchers selected for those storms that made landfall along a track similar to that of Milton. Using these, they show that the warming climate has boosted the frequency of storms of Milton’s intensity by 40 percent. Correspondingly, the maximum wind speeds of similar storms have been boosted by about 10 percent. In Milton’s case, that means that, in the absence of climate change, it was likely to have made landfall as a Category 2 storm, rather than the Category 3 it actually was.

Rainfall

The lack of full meteorological data caused a problem when it came to analyzing Milton’s rainfall. The researchers ended up having to analyze rainfall more generally. They took four data sets that do track rainfall across these regions and tracked the link between extreme rainfall and the warming climate to estimate how much more often extreme events occur in a world that is now 1.3° C warmer than it was in pre-industrial times.

They focus on instances of extreme one-day rainfall within the June to November period, looking specifically at 1-in-10-year and 1-in-100-year events. Both of these produced similar results, suggesting that heavy one-day rainfalls are about twice as likely in today’s climates, and the most extreme of these are between 20 and 30 percent more intense.

These results came from three of the four data sets used, which produced largely similar results. The fourth dataset they used suggested a far stronger effect of climate change, but since it wasn’t consistent with the rest, these results weren’t used.

As with the Helene analysis, it’s worth noting that this work represents a specific snapshot in time along a long-term warming trajectory. In other words, it’s looking at the impact of 1.3° C of warming at a time when our emissions are nearly at the point where they commit us to at least 1.5° C of warming. And that will tilt the scales further in favor of extreme weather events like this.

Climate change boosted Milton’s landfall strength from Category 2 to 3 Read More »

rapid-analysis-finds-climate-change’s-fingerprint-on-hurricane-helene

Rapid analysis finds climate change’s fingerprint on Hurricane Helene

The researchers identified two distinct events associated with Helene’s landfall. The first was its actual landfall along the Florida coast. The second was the intense rainfall on the North Carolina/Tennessee border. This rainfall came against a backdrop of previous heavy rain caused by a stalled cold front meeting moisture brought north by the fringes of the hurricane. These two regions were examined separately.

A changed climate

In these two regions, the influence of climate change is estimated to have caused a 10 percent increase in the intensity of the rainfall. That may not seem like much, but it adds up. Over both a two- and three-day window centered on the point of maximal rainfall, climate change is estimated to have increased rainfall along the Florida Coast by 40 percent. For the southern Appalachians, the boost in rainfall is estimated to have been 70 percent.

The probability of storms with the wind intensity of Helene hitting land near where it did is about a once-in-130-year event in the IRIS dataset. Climate change has altered that so it’s now expected to return about once every 50 years. The high sea surface temperatures that helped fuel Helene are estimated to have been made as much as 500 times more likely by our changed climate.

Overall, the researchers estimate that rain events like Helene’s landfall should now be expected about once every seven years, although the uncertainty is large (running from three to 25 years). For the Appalachian region, where rainfall events this severe don’t appear in our records, they are likely to now be a once-in-every-70-years event thanks to climate warming (with an uncertainty of between 20 and 3,000 years).

“Together, these findings show that climate change is enhancing conditions conducive to the most powerful hurricanes like Helene, with more intense rainfall totals and wind speeds,” the researchers behind the work conclude.

Rapid analysis finds climate change’s fingerprint on Hurricane Helene Read More »

how-did-volcanism-trigger-climate-change-before-the-eruptions-started?

How did volcanism trigger climate change before the eruptions started?

Image of a person in a stream-filled gap between two tall rock faces.

Enlarge / Loads of lava: Kasbohm with a few solidified lava flows of the Columbia River Basalts.

Joshua Murray

As our climate warms beyond its historical range, scientists increasingly need to study climates deeper in the planet’s past to get information about our future. One object of study is a warming event known as the Miocene Climate Optimum (MCO) from about 17 to 15 million years ago. It coincided with floods of basalt lava that covered a large area of the Northwestern US, creating what are called the “Columbia River Basalts.” This timing suggests that volcanic CO2 was the cause of the warming.

Those eruptions were the most recent example of a “Large Igneous Province,” a phenomenon that has repeatedly triggered climate upheavals and mass extinctions throughout Earth’s past. The Miocene version was relatively benign; it saw CO2 levels and global temperatures rise, causing ecosystem changes and significant melting of Antarctic ice, but didn’t trigger a mass extinction.

A paper just published in Geology, led by Jennifer Kasbohm of the Carnegie Science’s Earth and Planets Laboratory, upends the idea that the eruptions triggered the warming while still blaming them for the peak climate warmth.

The study is the result of the world’s first successful application of high-precision radiometric dating on climate records obtained by drilling into ocean sediments, opening the door to improved measurements of past climate changes. As a bonus, it confirms the validity of mathematical models of our orbits around the Solar System over deep time.

A past climate with today’s CO2 levels

“Today, with 420 parts per million [of CO2], we are basically entering the Miocene Climate Optimum,” said Thomas Westerhold of the University of Bremen, who peer-reviewed Kasbohm’s study. While our CO2 levels match, global temperatures have not yet reached the MCO temperatures of up to 8° C above the preindustrial era. “We are moving the Earth System from what we call the Ice House world… in the complete opposite direction,” said Westerhold.

When Kasbohm began looking into the link between the basalts and the MCO’s warming in 2015, she found that the correlation had huge uncertainties. So she applied high-precision radiometric dating, using the radioactive decay of uranium trapped within zircon crystals to determine the age of the basalts. She found that her new ages no longer spanned the MCO warming. “All of these eruptions [are] crammed into just a small part of the Miocene Climate Optimum,” said Kasbohm.

But there were also huge uncertainties in the dates for the MCO, so it was possible that the mismatch was an artifact of those uncertainties. Kasbohm set out to apply the same high-precision dating to the marine sediments that record the MCO.

A new approach to an old problem

“What’s really exciting… is that this is the first time anyone’s applied this technique to sediments in these ocean drill cores,” said Kasbohm.

Normally, dates for ocean sediments drilled from the seabed are determined using a combination of fossil changes, magnetic field reversals, and aligning patterns of sediment layers with orbital wobbles calculated by astronomers. Each of those methods has uncertainties that are compounded by gaps in the sediment caused by the drilling process and by natural pauses in the deposition of material. Those make it tricky to match different records with the precision needed to determine cause and effect.

The uncertainties made the timing of the MCO unclear.

Tiny clocks: Zircon crystals from volcanic ash that fell into the Caribbean Sea during the Miocene.

Enlarge / Tiny clocks: Zircon crystals from volcanic ash that fell into the Caribbean Sea during the Miocene.

Jennifer Kasbohm

Radiometric dating would circumvent those uncertainties. But until about 15 years ago, its dates had such large errors that they were useless for addressing questions like the timing of the MCO. The technique also typically needs kilograms of material to find enough uranium-containing zircon crystals, whereas ocean drill cores yield just grams.

But scientists have significantly reduced those limitations: “Across the board, people have been working to track and quantify and minimize every aspect of uncertainty that goes into the measurements we make. And that’s what allows me to report these ages with such great precision,” Kasbohm said.

How did volcanism trigger climate change before the eruptions started? Read More »

string-of-record-hot-months-came-to-an-end-in-july

String of record hot months came to an end in July

Hot, but not that hot —

July had the two hottest days recorded but fell 0.04° Celsius short of last year.

Image of a chart with many dull grey squiggly lines running left to right, with an orange and red line significantly above the rest.

Enlarge / Absolute temperatures show how similar July 2023 and 2024 were.

The past several years have been absolute scorchers, with 2023 being the warmest year ever recorded. And things did not slow down in 2024. As a result, we entered a stretch where every month set a new record as the warmest iteration of that month that we’ve ever recorded. Last month, that pattern stretched out for a full 12 months, as June of 2024 once again became the warmest June ever recorded. But, despite some exceptional temperatures in July, it fell just short of last July’s monthly temperature record, bringing the streak to a close.

Europe’s Copernicus system was first to announce that July of 2024 was ever so slightly cooler than July of 2023, missing out on setting a new record by just 0.04° C. So far, none of the other major climate trackers, such as Berkeley Earth or NASA GISS, have come out with data for July. These each have slightly different approaches to tracking temperatures, and, with a margin that small, it’s possible we’ll see one of them register last month as warmer or statistically indistinguishable.

How exceptional are the temperatures of the last few years? The EU averaged every July from 1991 to 2020—a period well after climate change had warmed the planet significantly—and July of 2024 was still 0.68° C above that average.

While it didn’t set a record, both the EU’s Copernicus climate service and NASA’s GISS found that it contained the warmest day ever recorded. In the EU’s case, they were the two hottest days recorded, as the temperatures on the 21st and 22nd were statistically indistinguishable, with only 0.01° C separating them. Late July and early August tend to be the warmest times of the year for surface air temperatures, so we’re likely past the point where any daily records will be set in 2024.

That’s all in terms of absolute temperatures. If you compare each day of the year only to instances of that day in the past, there have been far more anomalous days in the temperature record.

In terms of anomalies over years past, both 2023 (orange) and 2024 (red) have been exceptionally warm.

Enlarge / In terms of anomalies over years past, both 2023 (orange) and 2024 (red) have been exceptionally warm.

That image also shows how exceptional the past year’s temperatures have been and makes it clear that 2024 is only falling out of record territory because the second half of 2023 was so exceptionally warm. It’s unlikely that 2024 will be quite as extreme, as the El Niño event that helped drive warming appears to have faded after peaking in December of 2023. NOAA’s latest forecast expects that the Pacific will remain in neutral for another month or two before starting to shift into cooler La Niña conditions before the year is out. (This is based on the August 8 ENSO forecast obtained here.)

In terms of anomalies, July also represents the first time in a year that a month had been less than 1.5° C above preindustrial temperatures (with preindustrial defined as the average over 1850–1900). Capping our modern temperatures at 1.5° C above preindustrial levels is recognized as a target that, while difficult to achieve, would help avoid some of the worst impacts we’ll see at 2° C of warming, and a number of countries have committed to that goal.

Listing image by Dmitriy83

String of record hot months came to an end in July Read More »