The park provides two covered pavilions with water troughs and tables for wet sifting, plus open sluice boxes with hand-operated water pumps at both ends of the field. Four shaded structures are available in the search area; however, visitors are also welcome to bring their own canopies or tents, provided they are well-secured.
The diamonds formed under extreme pressure and heat deep in the Earth’s mantle. If you find one, it will most likely look like a metallic or glassy pebble rather than a sparkly cut gem that you might picture in your mind. The volcanic soil also contains amethyst, garnet, jasper, agate, and various types of quartz (and you can keep those, too).
The largest diamond found in the United States came from this field—the 40.23-carat Uncle Sam diamond, discovered in 1924 before the land became a state park. In September 2021, California visitor Noreen Wredberg found a 4.38-carat yellow diamond after searching for two hours, and in 2024, a visitor named Julien Navas found a 7.46-carat diamond at the park.
The park received over 180,000 visitors in 2017, who found 450 certified diamonds of various colors. Of the reported diamond finds, 299 were white, 72 were brown, and 74 were yellow.
Park staff told Mays that visitors find one or two diamonds daily, so “keep your expectations in check,” she writes. Most diamonds discovered are about the size of a paper match head, while a one-carat diamond is roughly the size of a green pea. But even tiny diamonds carry the thrill of discovery. Park staff provide free identification services, examining finds under loupes and confirming whether that glassy pebble is quartz or something more valuable.
A family experience
For those wanting to join the thousands who visit each year, the park makes it affordable. Admission costs $15 for adults, $7 for children ages 6–12. You can camp overnight at the park and return to the field at dawn. During summer months, the park operates a small water park—an acknowledgment that diamond hunting in Arkansas can be brutal, with a heat index exceeding 110° Fahrenheit.
Sometimes rain turns the field into mud, which experienced searchers prefer because it makes diamonds easier to spot—but it can make for a messy adventure. As Mays put it, “Most visitors leave with a handful of interesting rocks, some newfound knowledge, and an urgent need for a long shower.”
If you don’t find any diamonds at the park, don’t despair—you could still potentially buy a $200,000 diamond-making machine on Alibaba.
A recent conference sees doubts raised about the age of the oldest signs of life.
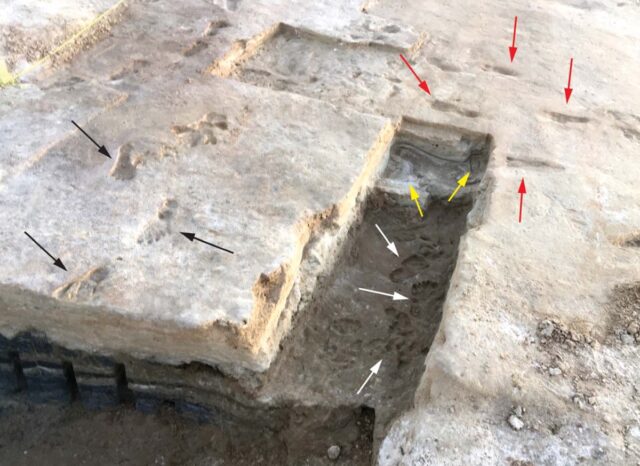
Where the microbe bodies are buried: metamorphosed sediments in Labrador, Canada containing microscopic traces of carbon. Credit: Martin Whitehouse
Where the microbe bodies are buried: metamorphosed sediments in Labrador, Canada containing microscopic traces of carbon. Credit: Martin Whitehouse
The question of when life began on Earth is as old as human culture.
“It’s one of these fundamental human questions: When did life appear on Earth?” said Professor Martin Whitehouse of the Swedish Museum of Natural History.
Whitehouse was among those skeptics. This July, he presented new evidence to the Goldschmidt Conference in Prague that the carbon in question is only between 2.7–2.8 billion years old, making it younger than other traces of life found elsewhere.
Organic carbon?
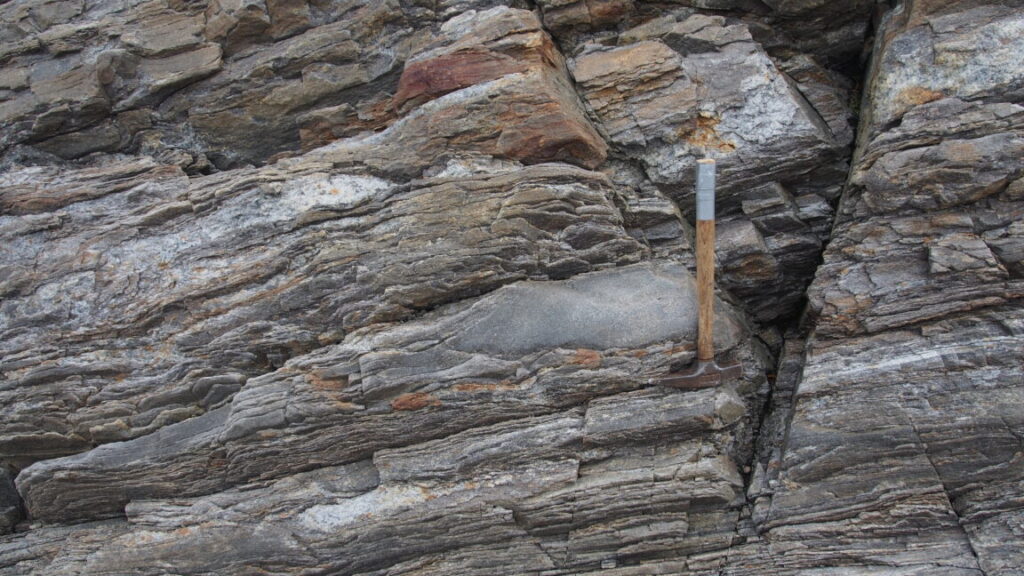
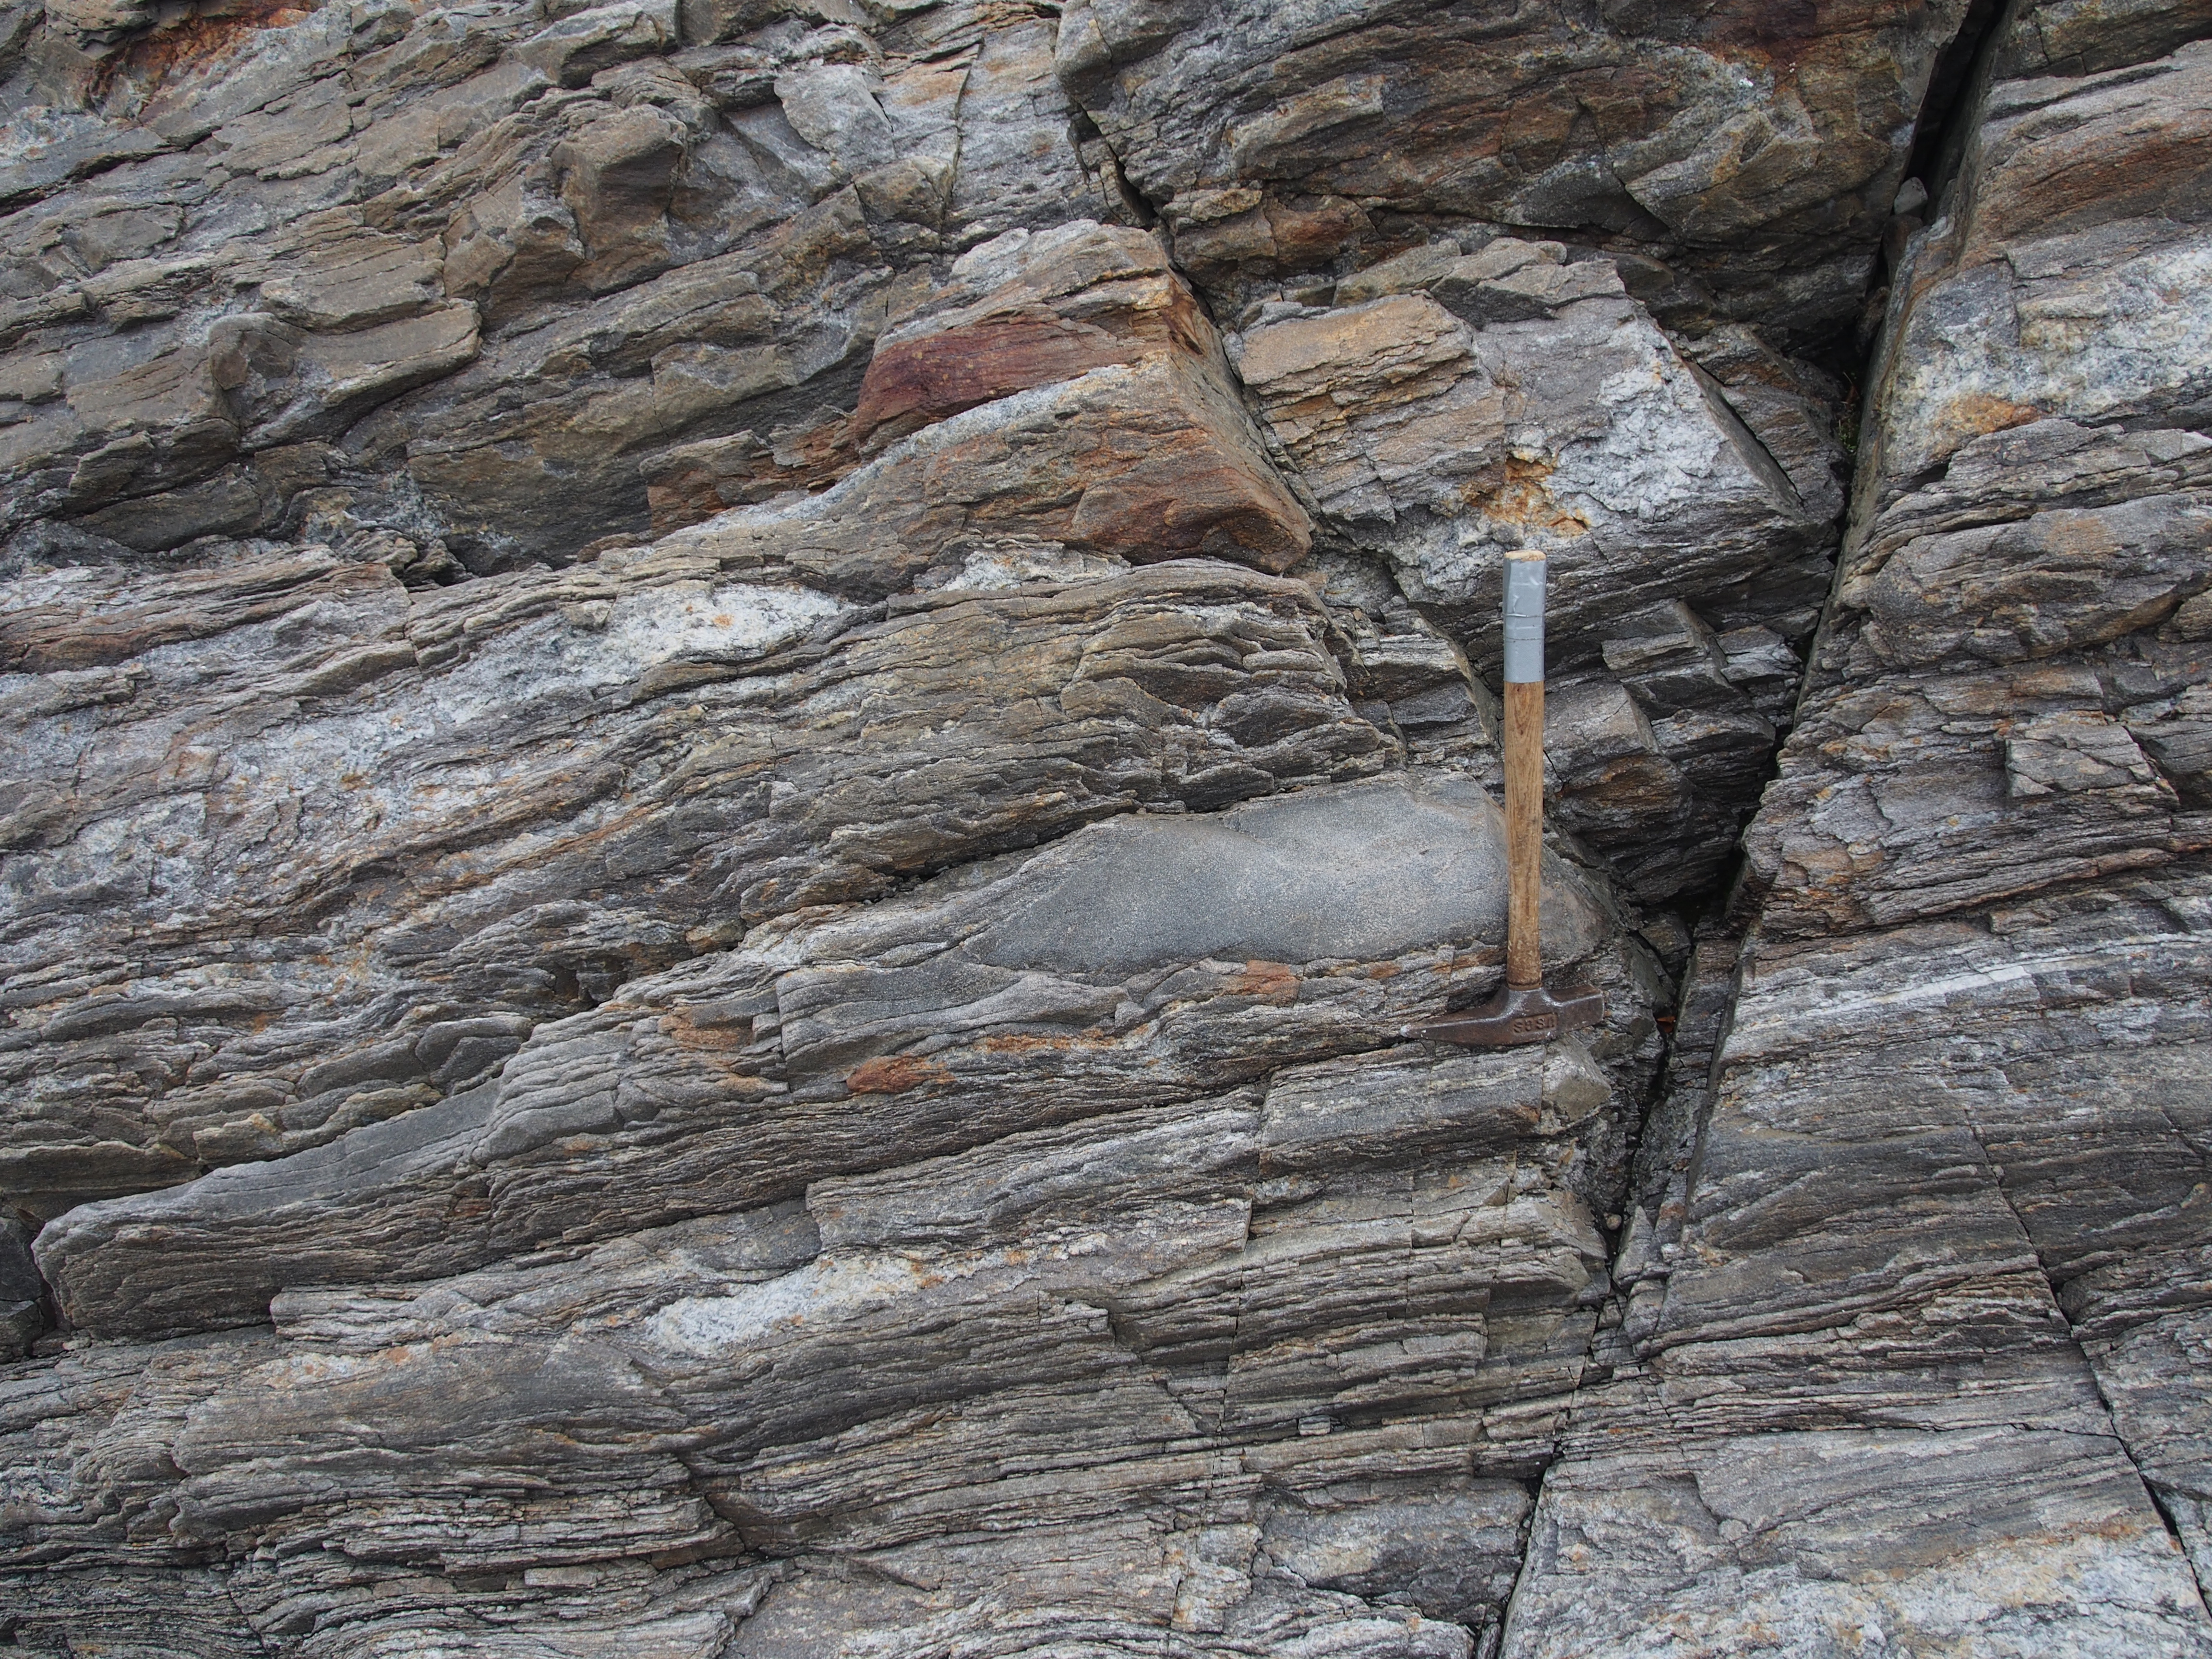
The carbon in question is in rock in Labrador, Canada. The rock was originally silt on the seafloor that, it’s argued, hosted early microbial life that was buried by more silt, leaving the carbon as their remains. The pressure and heat of deep burial and tectonic events over eons have transformed the silt into a hard metamorphic rock, and the microbial carbon in it has metamorphosed into graphite.
“They are very tiny, little graphite bits,” said Whitehouse.
The key to showing that this graphite was originally biological versus geological is its carbon isotope ratio. From life’s earliest days, its enzymes have preferred the slightly lighter isotope carbon-12 over the marginally heavier carbon-13. Organic carbon is therefore much richer in carbon-12 than geological carbon, and the Labrador graphite does indeed have this “light” biological isotope signature.
The key question, however, is its true age.
Mixed-up, muddled-up, shook-up rocks
Sorting out the age of the carbon-containing Labrador rock is a geological can of worms.
These are some of the oldest rocks on the planet—they’ve been heated, squished, melted, and faulted multiple times as Earth went through the growth, collision, and breakup of continents before being worn down by ice and exposed today.
“That rock itself is unbelievably complicated,” said Whitehouse. “It’s been through multiple phases of deformation.”
In general, the only ways to date sediments are if there’s a layer of volcanic ash in them, or by distinctive fossils in the sediments. Neither is available in these Labrador rocks.
“The rock itself is not directly dateable,” said Whitehouse, “so then you fall onto the next best thing, which is you want to look for a classic field geology cross-cutting relationship of something that is younger and something that you can date.”
The idea, which is as old as the science of geology itself, is to bracket the age of the sediment by finding a rock formation that cuts across it. Logically, the cross-cutting rock is younger than the sediment it cuts across.
In this case, the carbon-containing metamorphosed siltstone is surrounded by swirly, gray banded gneiss rock, but the boundary between the siltstone and the gray gneiss is parallel, so there’s no cross-cutting to use.
Professor Tsuyoshi Komiya of The University of Tokyo was a coauthor on the 3.95 billion-year age paper. His team used a cross-cutting rock they found at a different location and extrapolated that to the carbon-bearing siltstone to constrain its age. “It was discovered that the gneiss was intruded into supracrustal rocks (mafic and sedimentary rocks),” said Komiya in an email to Ars Technica.
But Whitehouse disputes that inference between the different outcrops.
“You’re reliant upon making these very long-distance assumptions and correlations to try to date something that might actually not have anything to do with what you think you’re dating,” he said.
Professor Jonathan O’Neil of the University of Ottawa, who was not involved in either Whitehouse’s or Komiya’s studies but who has visited the outcrops in question, agrees with Whitehouse. “I remember I was not convinced either by these cross-cutting relationships,” he told Ars. “It’s not clear to me that one is necessarily older than the other.”
With the field geology evidence disputed, the other pillar holding up the 3.95-billion-year-old date is its radiometric date, measured in zircon crystals extracted from the rocks surrounding the metamorphosed siltstone.
The zircon keeps the score
Geologists use the mineral zircon to date rocks because when it crystallizes, it incorporates uranium but not lead. So as radioactive uranium slowly decays into lead, the ratio of uranium to lead provides the age of the crystal.
But the trouble with any date obtained from rocks as complicated as these is knowing exactly what geological event it dates—the number alone means little without the context of all the other geological evidence for the events that affected the area.
Both Whitehouse and O’Neil have independently sampled and dated the same rocks as Komiya’s team, and where Komiya’s team got a date of 3.95, Whitehouse’s and O’Neil’s new dates are both around 3.87 billion years. Importantly, O’Neil’s and Whitehouse’s dates are far more precise, with errors around plus-or-minus 5 or 6 million years, which is remarkably precise for dates in rocks this old. The 3.95 date had an error around 10 times bigger. “It’s a large error,” said O’Neil.
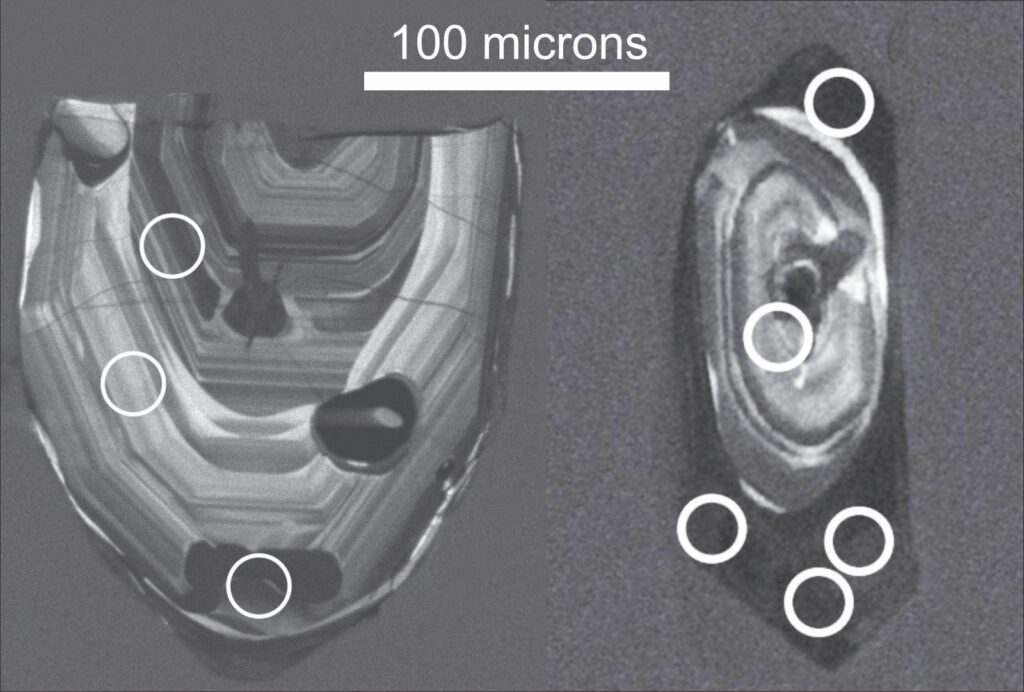
But there’s a more important question: How is that date related to the age of the organic carbon? The rocks have been through many events that could each have “set” the dates in the zircons. That’s because zircons can survive multiple re-heatings and even partial remelting, with each new event adding a new layer, or “zone,” on the outer surface of the crystal, recording the age of that event.
“This rock has seen all the events, and the zircon in it has responded to all of these events in a way that, when you go in with a very small-scale ion beam to do the sampling on these different zones, you can pick apart the geological history,” Whitehouse said.
Whitehouse’s team zapped tiny spots on the zircons with a beam of negatively charged oxygen ions to dislodge ions from the crystals, then sucked away these ions into a mass spectrometer to measure the uranium-lead ratio, and thus the dates. The tiny beam and relatively small error have allowed Whitehouse to document the events that these rocks have been through.
“Having our own zircon means we’ve been able to go in and look in more detail at the internal structure in the zircon,” said Whitehouse. “Where we might have a core that’s 3.87, we’ll have a rim that is 2.7 billion years, and that rim, morphologically, looks like an igneous zircon,” said Whitehouse.
That igneous outer rim of Whitehouse’s zircons shows that it formed in partially molten rock that would have flowed at that time. That flow was probably what brought it next to the carbon-containing sediments. Its date of 2.7 billion years ago means the carbon in the sediments could be any age older than that.
That’s a key difference from Komiya’s work. He argues that the older dates in the cores of the zircons are the true age of the cross-cutting rock. “Even the igneous zircons must have been affected by the tectonothermal event; therefore, the obtained age is the minimum age, and the true age is older,” said Komiya. “The fact that young zircons were found does not negate our research.”
But Whitehouse contends that the old cores of the zircons instead record a time when the original rock formed, long before it became a gneiss and flowed next to the carbon-bearing sediments.
Zombie crystals
Zircon’s resilience means it can survive being eroded from the rock where it formed and then deposited in a new, sedimentary rock as the undead remnants of an older, now-vanished landscape.
The carbon-containing siltstone contains zombie zircons, and Whitehouse presented new data on them to the Goldschmidt Conference, dating them to 2.8 billion years ago. Whitehouse argues that these crystals formed in an igneous rock 2.8 billion years ago and then were eroded, washed into the sea, and settled in the silt. So the siltstone must be no older than 2.8 billion years old, he said.
“You cannot deposit a zircon that is not formed yet,” O’Neil explained.
Tiny recorders of history – ancient zircon crystals from Labrador. Left shows layers built up as the zircon went through many heating events. Right shows a zircon with a prism-like outer shape showing that it formed in igneous conditions around an earlier zircon. Circles indicate where an ion beam was used to measure dates. Credit: Martin Whitehouse
This 2.8-billion-year age, along with the igneous zircon age of 2.7 billion years, brackets the age of the organic carbon to anywhere between 2.8 and 2.7 billion years old. That’s much younger than Komiya’s date of 3.95 billion years old.
Komiya disagrees: “I think that the estimated age is minimum age because zircons suffered from many thermal events, so that they were rejuvenated,” he said. In other words, the 2.8-billion-year age again reflects later heating, and the true date is given by the oldest-dated zircons in the siltstone.
But Whitehouse presented a third line of evidence to dispute the 3.95-billion-year date: isotopes of hafnium in the same zombie zircon crystals.
The technique relies on radioactive decay of lutetium-176 to hafnium-176. If the 2.8-billion-year age resulted from rejuvenation by later heating, it would have had to have formed from material with a hafnium isotope ratio incompatible with the isotope composition of the early Earth.
“They go to impossible numbers,” said Whitehouse.
The only way that the uranium-lead ratio can be compatible with the hafnium in the zircons, Whitehouse argued, is if the zircons that settled in the silt had crystallized around 2.8 billion years ago, constraining the organic carbon to being no older than that.
The new oldest remains of life on Earth, for now
If the Labrador carbon is no longer the oldest trace of life on Earth, then where are the oldest remains of life now?
For Whitehouse, it’s in the 3.77-billion-year-old Isua Greenstone Belt in Greenland: “I’m willing to believe that’s a well-documented age… that’s what I think is the best evidence for the oldest biogenicity that we have,” said Whitehouse.
O’Neil recently co-authored a paper on Earth’s oldest surviving crustal rocks, located next to Hudson Bay in Canada. He points there. “I would say it’s in the Nuvvuagittuq Greenstone belt,” said O’Neil, “because I would argue that these rocks are 4.3 billion years old. Again, not everybody agrees!” Intriguingly, the rocks he is referring to contain carbon with a possibly biological origin and are thought to be the remains of the kind of undersea vent where life could well have first emerged.
But the bigger picture is the fact that we have credible traces of life of this vintage—be it 3.8 or 3.9 or 4.3 billion years.
O’Neil thinks that once conditions on Earth were habitable, life would have emerged relatively fast: “To me, it’s not shocking, because the conditions were the same,” he said. “The Earth has the luxury of time… but biology is very quick. So if all the conditions were there by 4.3 billion years old, why would biology wait 500 million years to start?”
Howard Lee is a freelance science writer focusing on the evolution of planet Earth through deep time. He earned a B.Sc. in geology and M.Sc. in remote sensing, both from the University of London, UK.
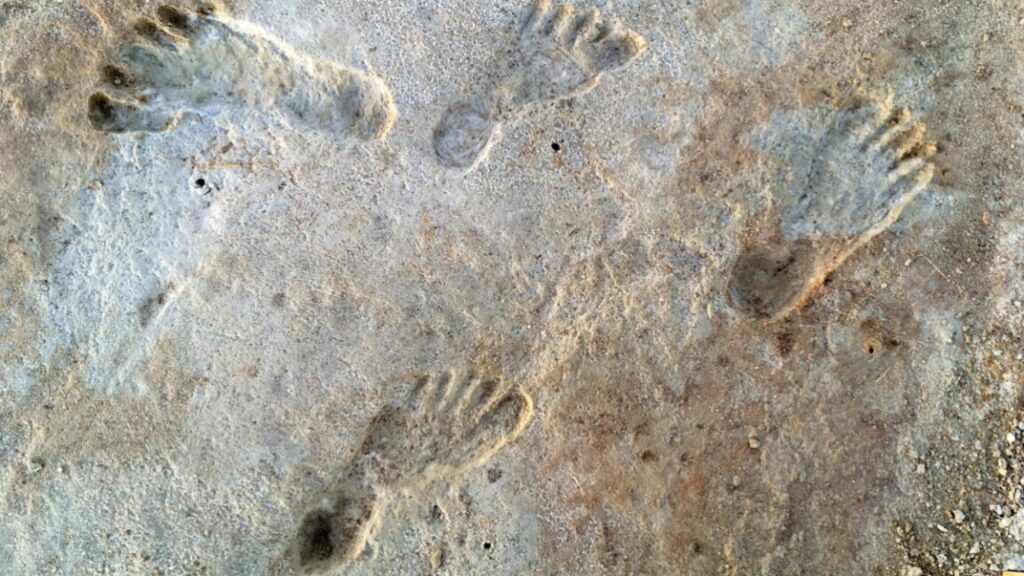
Some of the sediment layers contained the remains of ancient grass seeds mixed with the sediment. Bennett and his colleagues radiocarbon-dated seeds from the layer just below the oldest footprints and the layer just above the most recent ones. According to those 2021 results, the oldest footprints were made sometime after 23,000 years ago; the most recent ones were made sometime before 21,000 years ago.
At that time, the northern half of the continent was several kilometers below massive sheets of ice. The existence of 23,000-year-old footprints could only mean that people were already living in what’s now New Mexico before the ice sheets sealed off the southern half of the continent from the rest of the world for the next few thousand years.
Ancient human footprints found in situ at White Sands National Park in New Mexico. Credit: Jeffrey S. Pigati et al., 2023
Other researchers were skeptical of those results, pointing out that the aquatic plants (Ruppia cirrhosa) analyzed were prone to absorbing the ancient carbon in groundwater, which could have skewed the findings and made the footprints seem older than they actually were. And the pollen samples weren’t taken from the same sediment layers as the footprints.
So the same team followed up by radiocarbon-dating pollen sampled from the same layers as some of the footprints—those that weren’t too thin for sampling. This pollen came from pine, spruce, and fir trees, i.e., terrestrial plants, thereby addressing the issue of groundwater carbon seeping into samples. They also analyzed quartz grains taken from clay just above the lowest layer of footprints using a different method, optically stimulated luminescence dating. They published those findings in 2023, which agreed with their earlier estimate.
NASA’s Apollo missions brought back moon rock samples for scientists to study. We’ve learned a great deal over the ensuing decades, but one enduring mystery remains. Many of those lunar samples show signs of exposure to strong magnetic fields comparable to Earth’s, yet the Moon doesn’t have such a field today. So, how did the moon rocks get their magnetism?
There have been many attempts to explain this anomaly. The latest comes from MIT scientists, who argue in a new paper published in the journal Science Advances that a large asteroid impact briefly boosted the Moon’s early weak magnetic field—and that this spike is what is recorded in some lunar samples.
Evidence gleaned from orbiting spacecraft observations, as well as results announced earlier this year from China’s Chang’e 5 and Chang’e 6 missions, is largely consistent with the existence of at least a weak magnetic field on the early Moon. But where did this field come from? These usually form in planetary bodies as a result of a dynamo, in which molten metals in the core start to convect thanks to slowly dissipating heat. The problem is that the early Moon’s small core had a mantle that wasn’t much cooler than its core, so there would not have been significant convection to produce a sufficiently strong dynamo.
There have been proposed hypotheses as to how the Moon could have developed a core dynamo. For instance, a 2022 analysis suggested that in the first billion years, when the Moon was covered in molten rock, giant rocks formed as the magma cooled and solidified. Denser minerals sank to the core while lighter ones formed a crust.
Over time, the authors argued, a titanium layer crystallized just beneath the surface, and because it was denser than lighter minerals just beneath, that layer eventually broke into small blobs and sank through the mantle (gravitational overturn). The temperature difference between the cooler sinking rocks and the hotter core generated convection, creating intermittently strong magnetic fields—thus explaining why some rocks have that magnetic signature and others don’t.
Or perhaps there is no need for the presence of a dynamo-driven magnetic field at all. For instance, the authors of a 2021 study thought earlier analyses of lunar samples may have been altered during the process. They re-examined samples from the 1972 Apollo 16 mission using CO2 lasers to heat them, thus avoiding any alteration of the magnetic carriers. They concluded that any magnetic signatures in those samples could be explained by the impact of meteorites or comets hitting the Moon.
The orbiters that carried the radar hardware, along with one or two others, have been orbiting long enough that any major changes in Mars’ gravity caused by ice accumulation or crustal displacement would have shown up in their orbital behavior. The orbital changes they do see, “indicates that the increase in the gravitational potential associated with long-term ice accumulation is higher than the decrease in gravitational potential from downward deflection.” They calculate that the deformation has to be less than 0.13 millimeters per year to be consistent with the gravitational signal.
Finally, the model had to have realistic conditions at the polar ice cap, with a density consistent with a mixture of ice and dust.
Out of those 84 models, only three were consistent with all of these constraints. All three had a very viscous Martian interior, consistent with a relatively cold interior. That’s not a surprise, given what we’ve already inferred about Mars’ history. But it also suggests that most of the radioactive elements that provide heat to the red planet are in the crust, rather than deeper in the interior. That’s something we might have been able to check, had InSight’s temperature measurement experiment deployed correctly. But as it is, we’ll have to wait until some unidentified future mission to get a picture of Mars’ heat dynamics.
In any case, the models also suggest that Mars’ polar ice cap is less than 10 million years old, consistent with the orbitally driven climate models.
In a lot of ways, the new information is an update of earlier attempts to model the Martian interior, given a few more years of orbital data and the information gained from the InSight lander, which also determined the thickness of Mars’ crust and size of its core. But it’s also a good way of understanding how scientists can take bits and pieces of information from seemingly unrelated sources and build them into a coherent picture.
The huge area covered by these mounds gives a sense of just how significant this erosion was. “The dichotomy boundary has receded several hundred kilometres,” the researchers note. “Nearly all intervening material—approximately 57,000 cubic kilometers over an area of 284,000 square kilometers west of Ares Vallis alone—has been removed, leaving only remnant mounds.”
Based on the distribution of the different clays, the team argues that their water-driven formation took place before the erosion of the material. This would indicate that water-rock interactions were going on over a very wide region early in the history of Mars, which likely required an extensive hydrological cycle on the red planet. As the researchers note, a nearby ocean would have improved the chances of exposing this region to water, but the exposure could also have been due to processes like melting at the base of an ice cap.
Complicating matters further, many of the mounds top out below one proposed shoreline of the northern ocean and above a second. It’s possible that a receding ocean could have contributed to their erosion. But, at the same time, some of the features of a proposed shoreline now appear to have been caused by the general erosion of the original plateau, and may not be associated with an ocean at all.
Overall, the new results provide mixed evidence for the presence of a Martian ocean. They clearly show an active water cycle and erosion on a massive scale, which are both consistent with having a lot of water around. At the same time, however, the water exposure the mesas and buttes have experienced needn’t have come through their being submerged by said ocean and, given their elevation, might best be explained through some other process.
There’s not enough melted material near the surface to trigger a massive eruption.
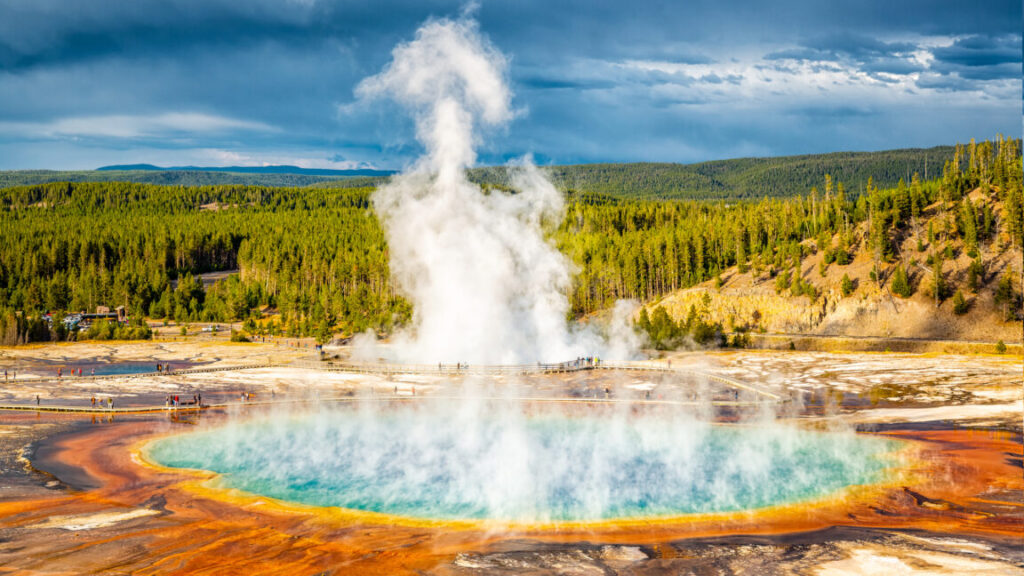
It’s difficult to comprehend what 1,000 cubic kilometers of rock would look like. It’s even more difficult to imagine it being violently flung into the air. Yet the Yellowstone volcanic system blasted more than twice that amount of rock into the sky about 2 million years ago, and it has generated a number of massive (if somewhat smaller) eruptions since, and there have been even larger eruptions deeper in the past.
All of which might be enough to keep someone nervously watching the seismometers scattered throughout the area. But a new study suggests that there’s nothing to worry about in the near future: There’s not enough molten material pooled in one place to trigger the sort of violent eruptions that have caused massive disruptions in the past. The study also suggests that the primary focus of activity may be shifting outside of the caldera formed by past eruptions.
Understanding Yellowstone
Yellowstone is fueled by what’s known as a hotspot, where molten material from the Earth’s mantle percolates up through the crust. The rock that comes up through the crust is typically basaltic (a definition based on the ratio of elements in its composition) and can erupt directly. This tends to produce relatively gentle eruptions where lava flows across a broad area, generally like you see in Hawaii and Iceland. But this hot material can also melt rock within the crust, producing a material called rhyolite. This is a much more viscous material that does not flow very readily and, instead, can cause explosive eruptions.
The risks at Yellowstone are rhyolitic eruptions. But it can be difficult to tell the two types of molten material apart, at least while they’re several kilometers below the surface. Various efforts have been made over the years to track the molten material below Yellowstone, but differences in resolution and focus have left many unanswered questions.
Part of the problem is that a lot of this data came from studies of seismic waves traveling through the region. Their travel is influenced by various factors, including the composition of the material they’re traveling through, its temperature, and whether it’s a liquid or solid. In a lot of cases, this leaves several potential solutions consistent with the seismic data—you can potentially see the same behavior from different materials at different temperatures.
To get around this issue, the new research measured the conductivity of the rock, which can change by as much as three orders of magnitude when transitioning from a solid to a molten phase. The overall conductivity we measure also increases as more of the molten material is connected into a single reservoir rather than being dispersed into individual pockets.
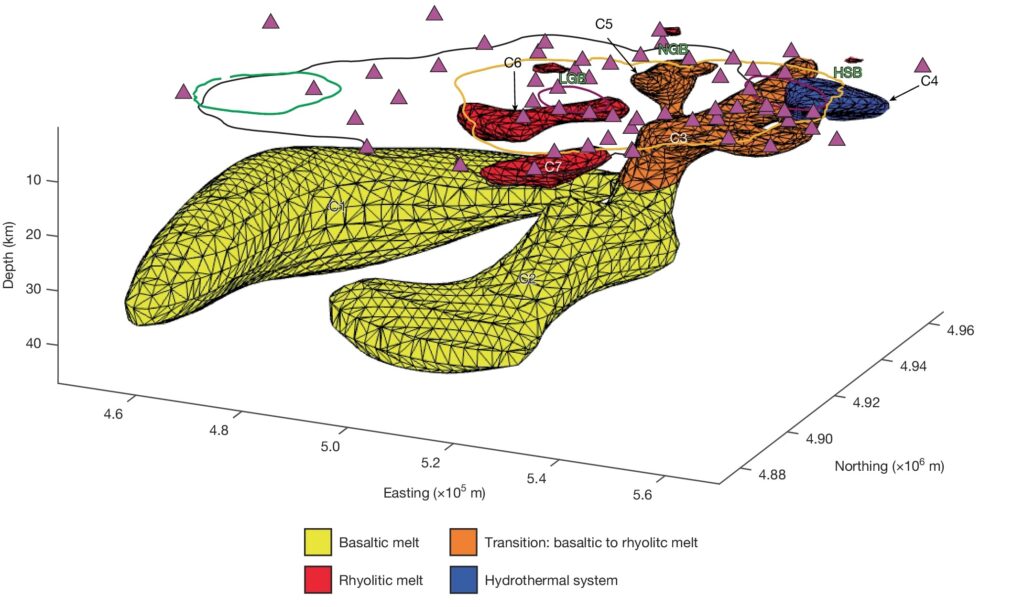
This sort of “magnetotelluric” data has been obtained in the past but at a relatively low resolution. For the new study, a dense array of sensors was placed in the Yellowstone caldera and many surrounding areas to the north and east. (You can compare the previous and new recording sites as black and red triangles on this map.)
Yellowstone’s plumbing
That has allowed the research team to build a three-dimensional map of the molten material underneath Yellowstone and to determine the fraction of the material in a given area that’s molten. The team finds that there are two major sources of molten material that extend up from the mantle-crust boundary at about 50 kilometers below the surface. These extend upward separately but merge about 20 kilometers below the surface.
Underneath Yellowstone: Two large lobs of hot material from the mantle (in yellow) melt rock closer to the surface (orange), creating pools of hot material (red and orange) that power hydrothermal systems and past eruptions, and may be the sites of future activity. Credit: Bennington, et al.
While they collectively contain a lot of molten basaltic material (between 4,000 and 6,500 cubic kilometers of it), it’s not very concentrated. Instead, this is mostly relatively small volumes of molten material traveling through cracks and faults in solid rock. This keeps the concentration of molten material below that needed to enable eruptions.
After the two streams of basaltic material merge, they form a reservoir that includes a significant amount of melted crustal material—meaning rhyolitic. The amount of rhyolitic material here is, at most, under 500 cubic kilometers, so it could fuel a major eruption, albeit a small one by historic Yellowstone standards. But again, the fraction of melted material in this volume of rock is relatively low and not considered likely to enable eruptions.
From there to the surface, there are several distinct features. Relative to the hotspot, the North American plate above is moving to the west, which has historically meant that the site of eruptions has moved from west to east across the continent. Accordingly, there is a pool off to the west of the bulk of near-surface molten material that no longer seems to be connected to the rest of the system. It’s small, at only about 100 cubic kilometers of material, and is too diffused to enable a large eruption.
Future risks?
There’s a similar near-surface blob of molten material that may not currently be connected to the rest of the molten material to the south of that. It’s even smaller, likely less than 50 cubic kilometers of material. But it sits just below a large blob of molten basalt, so it is likely to be receiving a fair amount of heat input. This site seems to have also fueled the most recent large eruption in the caldera. So, while it can’t fuel a large eruption today, it’s not possible to rule the site out for the future.
Two other near-surface areas containing molten material appear to power two of the major sites of hydrothermal activity, the Norris Geyser Basin and Hot Springs Basin. These are on the northern and eastern edges of the caldera, respectively. The one to the east contains a small amount of material that isn’t concentrated enough to trigger eruptions.
But the site to the northeast contains the largest volume of rhyolitic material, with up to nearly 500 cubic kilometers. It’s also one of only two regions with a direct connection to the molten material moving up through the crust. So, while it’s not currently poised to erupt, this appears to be the most likely area to trigger a major eruption in the future.
In summary, while there’s a lot of molten material near the current caldera, all of it is spread too diffusely within the solid rock to enable it to trigger a major eruption. Significant changes will need to take place before we see the site cover much of North America with ash again. Beyond that, the image is consistent with our big-picture view of the Yellowstone hotspot, which has left a trail of eruptions across western North America, driven by the movement of the North American plate.
That movement has now left one pool of molten material on the west of the caldera disconnected from any heat sources, which will likely allow it to cool. Meanwhile, the largest pool of near-surface molten rock is east of the caldera, which may ultimately drive a transition of explosive eruptions outside the present caldera.
John is Ars Technica’s science editor. He has a Bachelor of Arts in Biochemistry from Columbia University, and a Ph.D. in Molecular and Cell Biology from the University of California, Berkeley. When physically separated from his keyboard, he tends to seek out a bicycle, or a scenic location for communing with his hiking boots.
All of which raises questions about what the snowball Earth might have looked like in the continental interiors. A team of US-based geologists think they’ve found some glacial deposits in the form of what are called the Tavakaiv sandstones in Colorado. These sandstones are found along the Front Range of the Rockies, including areas just west of Colorado Springs. And, if the authors’ interpretations are correct, they formed underneath a massive sheet of glacial ice.
There are lots of ways to form sandstone deposits, and they can be difficult to date because they’re aggregates of the remains of much older rocks. But in this case, the Tavakaiv sandstone is interrupted by intrusions of dark colored rock that contains quartz and large amounts of hematite, a form of iron oxide.
These intrusions tell us a remarkable number of things. For one, some process must have exerted enough force to drive material into small faults in the sandstone. Hematite only gets deposited under fairly specific conditions, which tells us a bit more. And, most critically, hematite can trap uranium and the lead it decays into, providing a way of dating when the deposits formed.
Under the snowball
Depending on which site was being sampled, the hematite produced a range of dates, from as recent as 660 million years ago to as old as 700 million years. That means all of them were formed during what’s termed the Sturtian glaciation, which ran from 715 million to 660 million years ago. At the time, the core of what is now North America was in the equatorial region. So, the Tavakaiv sandstones can provide a window into what at least one continent experienced during the most severe global glaciation of the Cryogenian Period.
Enlarge/ Artist’s conception of the state of the Earth during its global glaciations.
Earth has gone through many geologic phases, but it did have one striking period of stasis: Our planet experienced a tropical environment where algae and single-celled organisms flourished for almost 2 billion years. Then things changed drastically as the planet was plunged into a deep freeze.
It was previously unclear when Earth became a gargantuan freezer. Now, University College London researchers have found evidence in an outcrop of rocks in Scotland, known as the Port Askaig Formation, that show evidence of the transition from a tropical Earth to a frozen one 717 million years ago. This marks the onset of the Sturtian glaciation and would be the first of two “snowball Earth” events during which much of the planet’s surface was covered in ice. It is thought that multicellular life began to emerge after Earth thawed.
Found in the Scottish islands known as the Garvellachs, this outcrop within the Port Askaig Formation is unique because it offers the first conclusive evidence of when a tropical Earth froze over—underlying layers that are a timeline from a warmer era to a frigid one. Other rocks that formed during the same time period in other parts of the world lack this transitional evidence because ancient glaciers most likely scraped it off.
“The Port Askaig preserves a relatively complete record of the global “Sturtian glaciation,” the researchers said in a study recently published in the Journal of the Geological Society.
In my snowball era
Underneath the rocks that formed during the Sturtian glaciation is a deep layer of carbonate rocks known as the Garb Eileach Formation. These were dated to the warm, tropical Tonian period, which started 1 billion years ago and lasted until 717 million years ago, when the cold took over. The youngest rocks in this formation are evidence of the transition to the first “snowball Earth.”
Why did Earth endure such a big chill to begin with? A sudden decrease in solar radiation probably led to an especially long winter that set off a (if you’ll pardon the pun) snowball effect. With less radiation, more ice forms, and more ice makes the planet more reflective, meaning it sends more sunlight back into space and causes the planet to continue cooling, allowing even more ice to form.
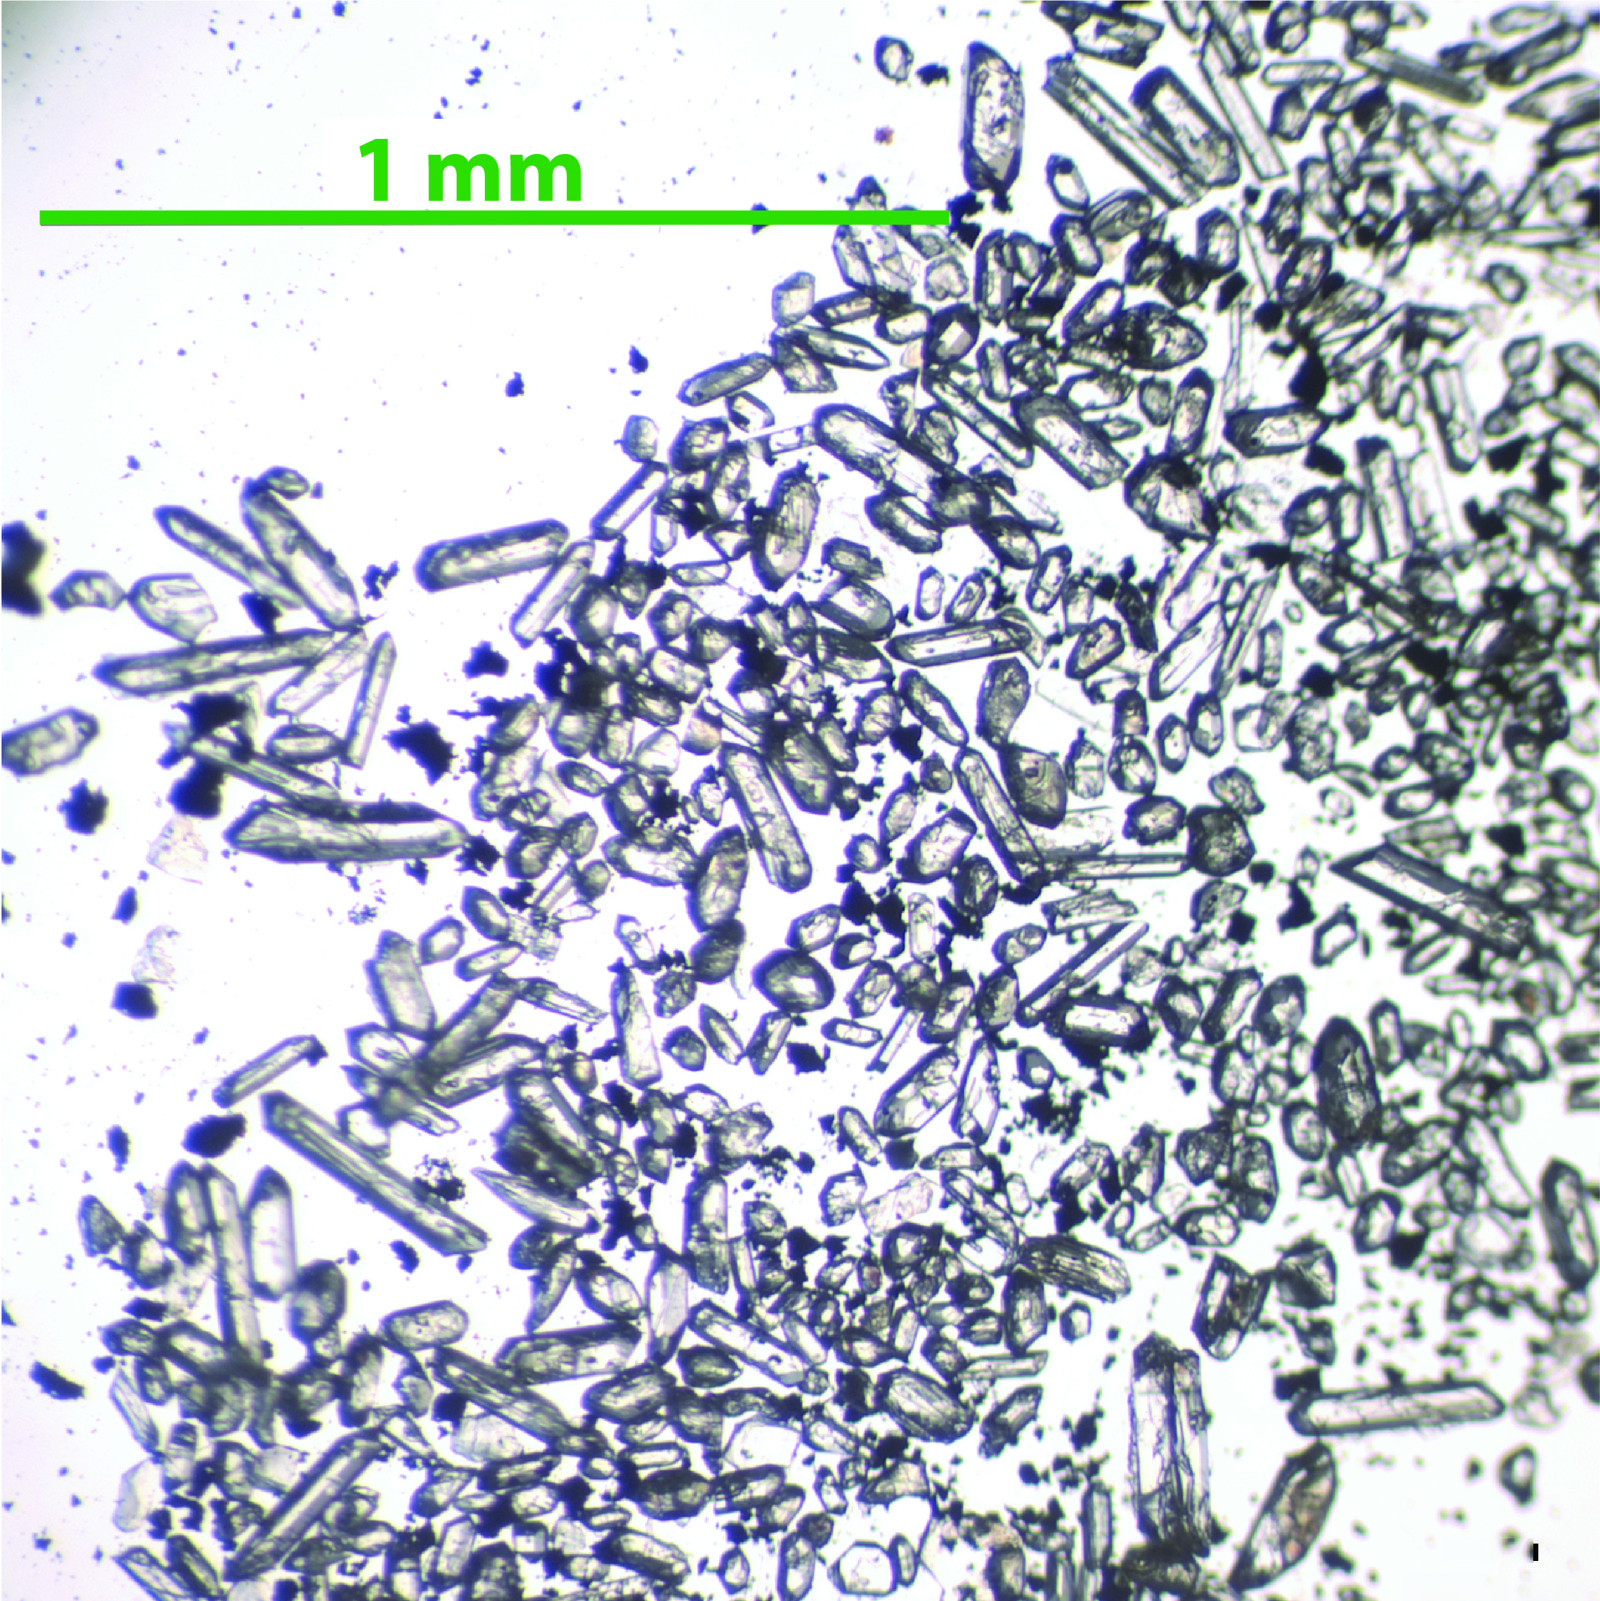
To find out when this global chill began, the research team collected 11 sandstone samples from the Garvellach Islands to analyze zircons in the sandstone. Zircons are especially useful in dating rock formations because they are often as old as the rock they are in, making some of them the oldest minerals on Earth. They also resist being chemically degraded. What is especially important about zircons is that they contain uranium, which decays into lead over long periods. The amount of uranium that has changed to lead can tell us the amount of time that has passed since the zircon’s formation.
Just a phase
Using both laser ablation (a type of laser imaging that reveals how elements and isotopes are distributed in a sample) and plasma mass spectrometry, the researchers determined the uranium-lead ratio. The time it had taken for the uranium to become lead was in line with their estimates, which were based on previous studies that had estimated, but not confirmed, the time of onset for the Sturtian glaciation.
Another thing that the outcrop’s zircons told the researchers is that the Sturtian glaciation lasted around 58 million years. It was closely followed by the Marinoan glaciation, thought to have lasted another 16 million years, and both these “snowball Earth” phases make up what is known as the Cryogenic period. The rocks containing these zircons were probably deposited by a moving glacier as the supercontinent Rodinia (which preceded the more famous Pangaea) was breaking apart.
The Port Askaig Formation is now, as the scientists say in the same study, “one of the thickest (up to 1.1 km) and most complete records of Cryogenic glaciation.”
Because glaciers did not scrape this formation away, a record of when Earth started to warm up again is also preserved. The zircon crystals that formed during the Sturtian glaciation gradually disappear in younger rocks until they are replaced by zircons formed after the ice began to melt. So not only is there evidence of the beginning of the deep freeze, but also evidence for the thaw that began around 635 million years ago.
As the ice melted, complex multicellular life began to burst onto the scene during the Ediacaran period. There could be several reasons for this. Hypotheses suggest that the temperature of the seawater rose, an influx of sunlight sparked photosynthesis, and there was a greater availability of nutrients than before.
The scientists involved in the Port Askaig study think that any life that survived the Cryogenian period faced an immense challenge once the ice began to melt. These organisms had been used to perpetual cold for millions of years, and now they faced the struggle of adapting as soon as possible—or perishing.
What about those that survived? They ended up being the ancestors of all animals that ever existed, and that includes us.
Enlarge/ Loads of lava: Kasbohm with a few solidified lava flows of the Columbia River Basalts.
Joshua Murray
As our climate warms beyond its historical range, scientists increasingly need to study climates deeper in the planet’s past to get information about our future. One object of study is a warming event known as the Miocene Climate Optimum (MCO) from about 17 to 15 million years ago. It coincided with floods of basalt lava that covered a large area of the Northwestern US, creating what are called the “Columbia River Basalts.” This timing suggests that volcanic CO2 was the cause of the warming.
A paper just published in Geology, led by Jennifer Kasbohm of the Carnegie Science’s Earth and Planets Laboratory, upends the idea that the eruptions triggered the warming while still blaming them for the peak climate warmth.
The study is the result of the world’s first successful application of high-precision radiometric dating on climate records obtained by drilling into ocean sediments, opening the door to improved measurements of past climate changes. As a bonus, it confirms the validity of mathematical models of our orbits around the Solar System over deep time.
A past climate with today’s CO2 levels
“Today, with 420 parts per million [of CO2], we are basically entering the Miocene Climate Optimum,” said Thomas Westerhold of the University of Bremen, who peer-reviewed Kasbohm’s study. While our CO2 levels match, global temperatures have not yet reached the MCO temperatures of up to 8° C above the preindustrial era. “We are moving the Earth System from what we call the Ice House world… in the complete opposite direction,” said Westerhold.
When Kasbohm began looking into the link between the basalts and the MCO’s warming in 2015, she found that the correlation had huge uncertainties. So she applied high-precision radiometric dating, using the radioactive decay of uranium trapped within zircon crystals to determine the age of the basalts. She found that her new ages no longer spanned the MCO warming. “All of these eruptions [are] crammed into just a small part of the Miocene Climate Optimum,” said Kasbohm.
But there were also huge uncertainties in the dates for the MCO, so it was possible that the mismatch was an artifact of those uncertainties. Kasbohm set out to apply the same high-precision dating to the marine sediments that record the MCO.
A new approach to an old problem
“What’s really exciting… is that this is the first time anyone’s applied this technique to sediments in these ocean drill cores,” said Kasbohm.
Normally, dates for ocean sediments drilled from the seabed are determined using a combination of fossil changes, magnetic field reversals, and aligning patterns of sediment layers with orbital wobbles calculated by astronomers. Each of those methods has uncertainties that are compounded by gaps in the sediment caused by the drilling process and by natural pauses in the deposition of material. Those make it tricky to match different records with the precision needed to determine cause and effect.
The uncertainties made the timing of the MCO unclear.
Enlarge/ Tiny clocks: Zircon crystals from volcanic ash that fell into the Caribbean Sea during the Miocene.
Jennifer Kasbohm
Radiometric dating would circumvent those uncertainties. But until about 15 years ago, its dates had such large errors that they were useless for addressing questions like the timing of the MCO. The technique also typically needs kilograms of material to find enough uranium-containing zircon crystals, whereas ocean drill cores yield just grams.
But scientists have significantly reduced those limitations: “Across the board, people have been working to track and quantify and minimize every aspect of uncertainty that goes into the measurements we make. And that’s what allows me to report these ages with such great precision,” Kasbohm said.
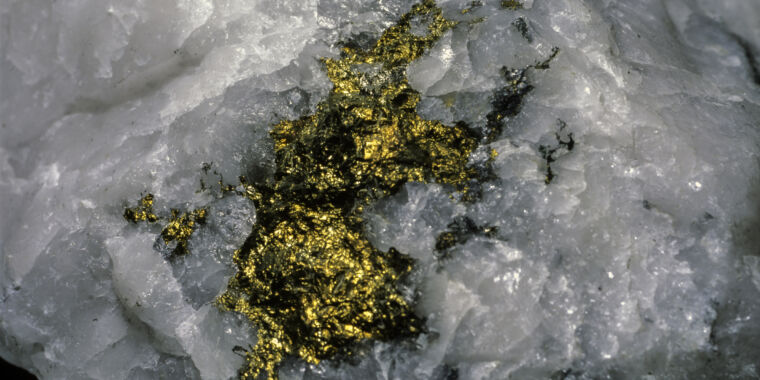
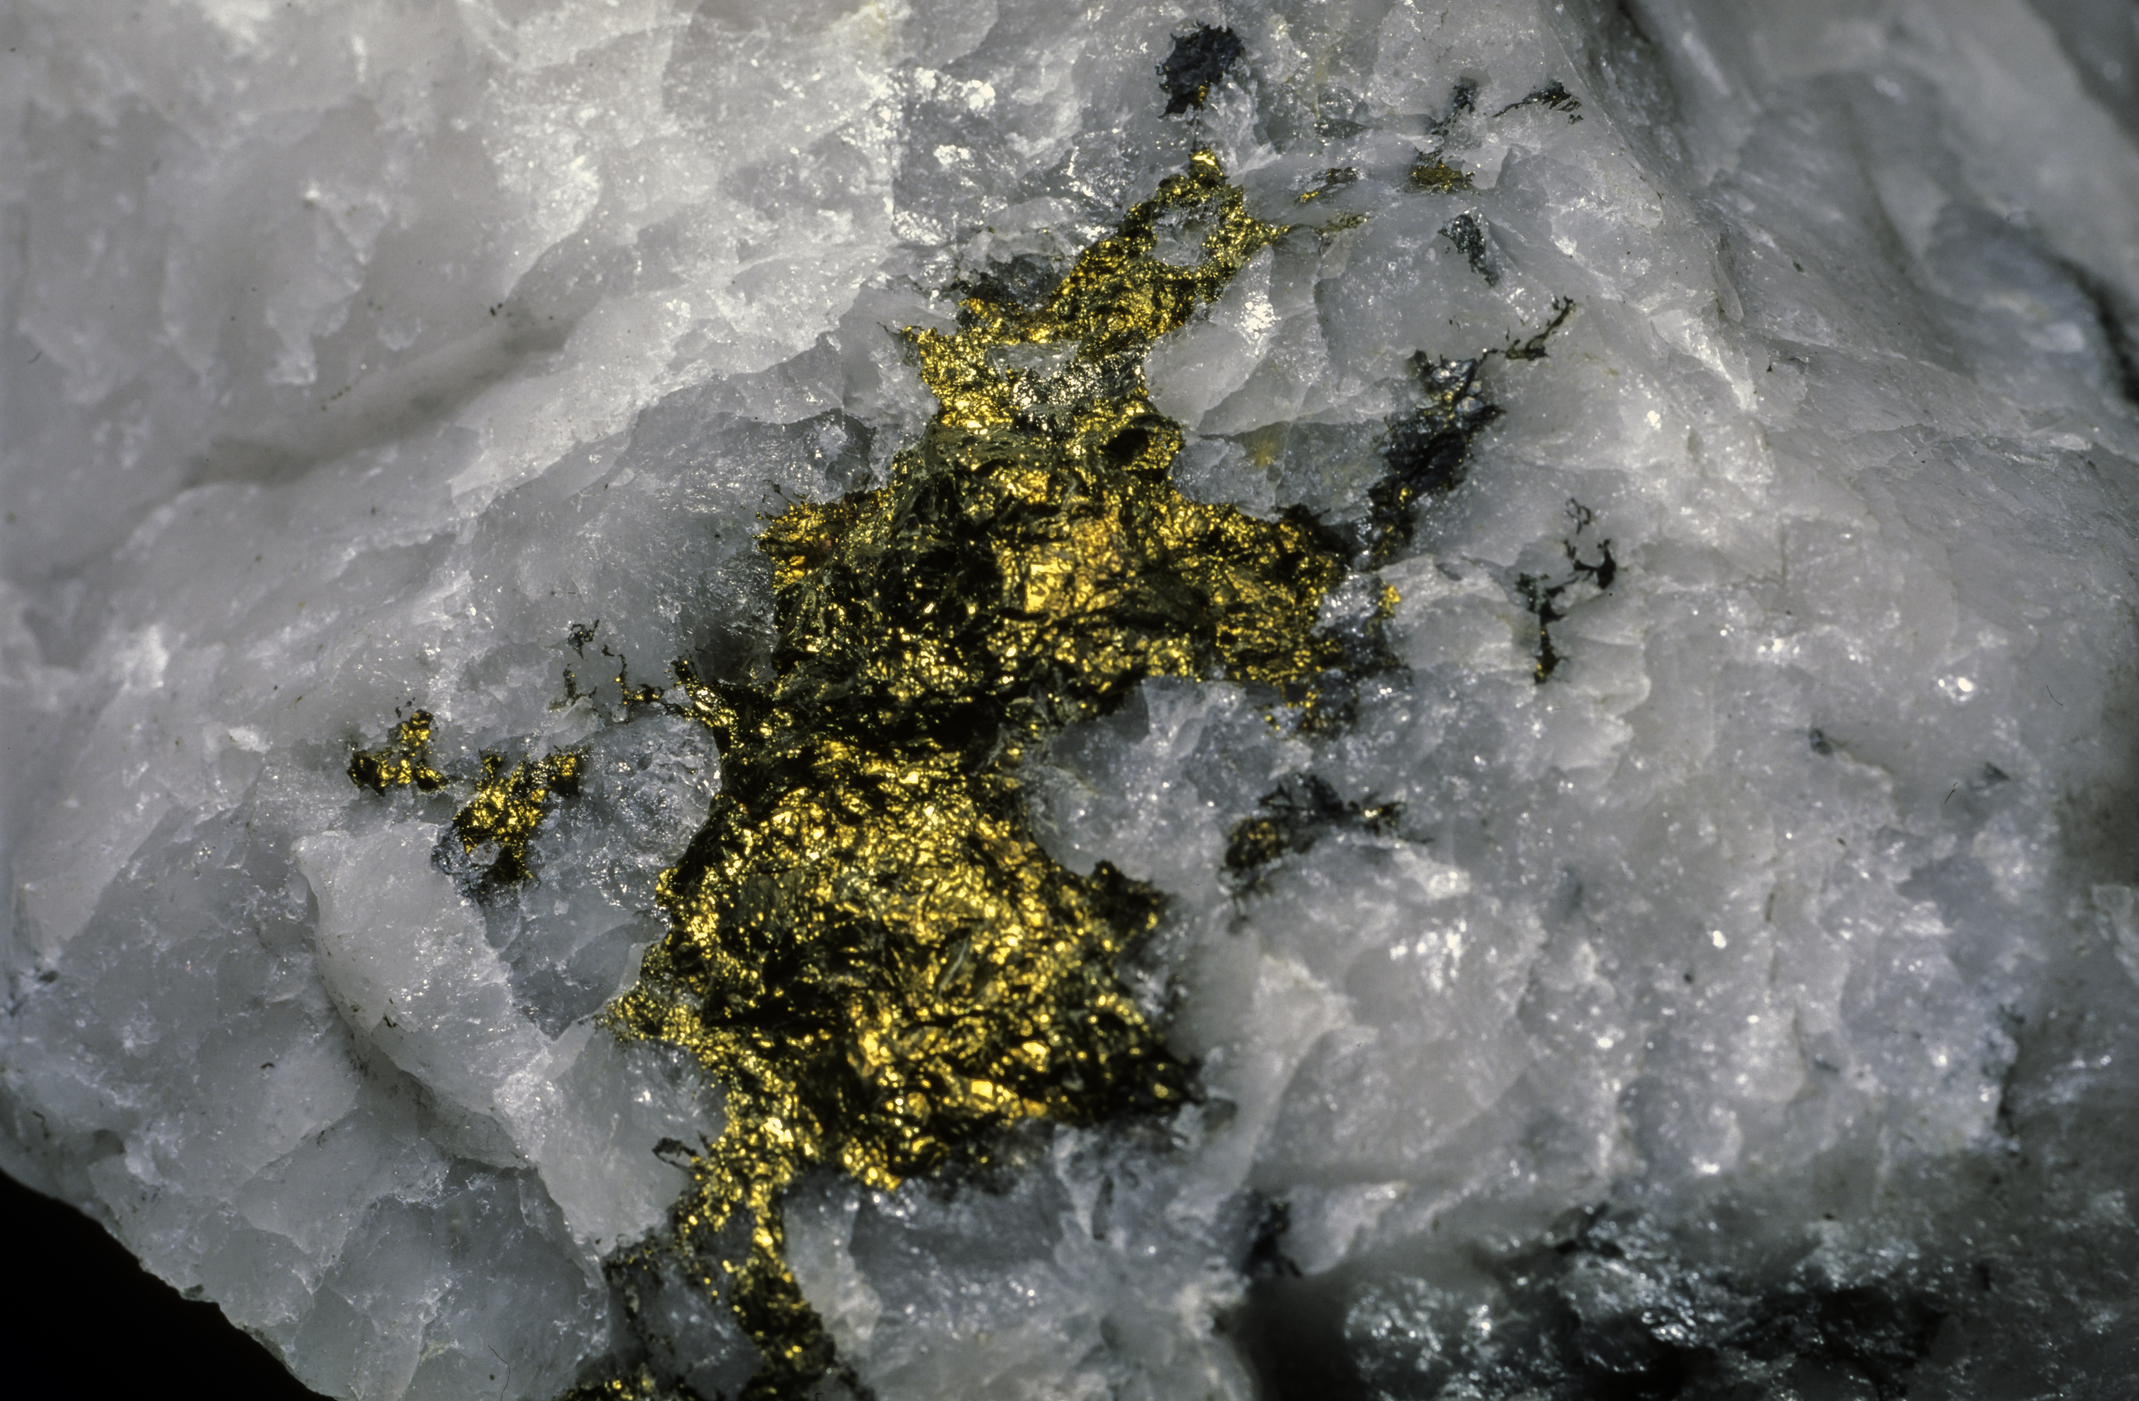
Enlarge/ A lot of gold deposits are found embedded in quartz crystals.
One of the reasons gold is so valuable is because it is highly unreactive—if you make something out of gold, it keeps its lustrous radiance. Even when you can react it with another material, it’s also barely soluble, a combination that makes it difficult to purify away from other materials. Which is part of why a large majority of the gold we’ve obtained comes from deposits where it is present in large chunks, some of them reaching hundreds of kilograms.
Those of you paying careful attention to the previous paragraph may have noticed a problem here: If gold is so difficult to get into its pure form, how do natural processes create enormous chunks of it? On Monday, a group of Australian researchers published a hypothesis, and a bit of evidence supporting it. They propose that an earthquake-triggered piezoelectric effect essentially electroplates gold onto quartz crystals.
The hypothesis
Approximately 75 percent of the gold humanity has obtained has come from what are called orogenic gold deposits. Orogeny is a term for the tectonic processes that build mountains, and orogenic gold deposits form in the seams where two bodies of rock are moving past each other. These areas are often filled with hot hydrothermal fluids, and the heat can increase the solubility of gold from “barely there” to “extremely low,” meaning generally less than a single milligram in a liter of water.
The other striking thing about these deposits is that they’re generally associated with the mineral quartz, a crystalline form of silicon dioxide. And that fact formed the foundation for the new hypothesis, which brings together a number of topics that are generally considered largely unrelated.
It turns out that quartz is the only abundant mineral that’s piezoelectric, meaning that it generates a charge when it’s placed under strain. While you don’t need to understand why that’s the case to follow this hypothesis, the researchers’ explanation of the piezoelectric effect is remarkably cogent and clear, so I’ll just quote it here for people who want to come away from this having learned something: “Quartz is the only common mineral that forms crystals lacking a center of symmetry (non-centrosymmetric). Non-centrosymmetric crystals distorted under stress have an imbalance in their internal electric configuration, which produces an electrical potential—or voltage—across the crystal that is directly proportional to the applied mechanical force.”
Quartz happens to be an insulator, so this electric potential doesn’t easily dissipate on its own. It can, however, be eliminated through the transfer of electrons to or from any materials that touch the quartz crystals, including fluids. In practice, that means the charge can drive redox (reduction/oxidation) reactions in any nearby fluids, potentially neutralizing any dissolved ions and causing them to come out of solution.
This has the potential to be self-reinforcing. Once a small metal deposit forms on the surface of quartz, it will ease the exchange of electrons with the fluid in its immediate vicinity, meaning more metal will be deposited in the same location. This will also lower the concentration of the metal in the nearby solution, which will favor the diffusion of additional metal ions into the location, meaning that the fluid itself doesn’t need to keep circulating past the same spot.
Finally, the concept also needs a source of strain to generate the piezoelectric effect in the first place. But remember that this is all happening in an active fault zone, so strain is not in short supply.
And the evidence
Figuring out whether this happens in active fault zones would be extremely challenging for all sorts of reasons. But it’s relatively easy to dunk some quartz crystals in a solution containing gold and see what happens. So the latter is the route the Australians took.
The gold came in the form of either a solution of gold chloride ions or a suspension of gold nanoparticles. Quartz crystals were either pure quartz or obtained from a gold-rich area and already contained some small gold deposits. The crystals themselves were subject to strain at a frequency similar to that produced by small earthquakes, and the experiment was left to run for an hour.
An hour was enough to get small gold deposits to form on the pure quartz crystals, regardless of whether it was from dissolved gold or suspended gold nanoparticles. In the case of the naturally formed quartz, the gold ended up being deposited on the existing sites where gold metal is present, rather than forming additional deposits.
The researchers note that a lot of the quartz in deposits is disordered rather than in the form of single crystals. In disordered material, there are lots of small crystals oriented randomly, meaning the piezoelectric effect of any one of these crystals is typically canceled out by its neighbors. So, gold will preferentially form on single crystals, which also helps explain why it’s found in large lumps in these deposits.
So, this is a pretty compelling hypothesis—it explains something puzzling, relies on well-established processes, and has a bit of experimental support. Given that activity in active faults is likely to remain both slow and inaccessible, the next steps are probably going to involve getting longer-term information on the rate of deposition through this process and a physical comparison of these deposits with those found in natural settings.
Because most things about Earth change so slowly, it’s difficult to imagine them being any different in the past. But Earth’s rotation has been slowing due to tidal interactions with the Moon, meaning that days were considerably shorter in the past. It’s easy to think that a 22-hour day wouldn’t be all that different, but that turns out not to be entirely true.
For example, some modeling has indicated that certain day lengths will be in resonance with other effects caused by the planet’s rotation, which can potentially offset the drag caused by the tides. Now, a new paper looks at how these resonances could affect the climate. The results suggest that it would shift rain to occurring in the morning and evening while leaving midday skies largely cloud-free. The resulting Earth would be considerably warmer.
On the Lamb
We’re all pretty familiar with the fact that the daytime Sun warms up the air. And those of us who remember high school chemistry will recall that a gas that is warmed will expand. So, it shouldn’t be a surprise to hear that the Earth’s atmosphere expands due to warming on its day side and contracts back again as it cools (these lag the daytime peak in sunlight). These differences provide something a bit like a handle that the gravitational pulls of the Sun and Moon can grab onto, exerting additional forces on the atmosphere. This complicated network of forces churns our atmosphere, helping shape the planet’s weather.
Two researchers, Russell Deitrick and Colin Goldblatt at Canada’s University of Victoria, were curious as to what would happen to these forces as the day length got shorter. Specifically, they were interested in a period where the day’s length would be at resonance with phenomena called Lamb waves.
Lamb waves aren’t specific to the atmosphere. Rather, they’re a specific manner in which a disturbance can travel through a medium, from vibrations in a solid to sound through the air.
Although various forces can create Lamb waves in the atmosphere, they’ll travel with a set of characteristic frequencies. One of those is roughly 10.5 to 11 hours. As you go back in time to shorter days, you’ll reach a point where the Earth’s day was a bit shorter than 22 hours, or twice the period of the Lamb waves. At this point, any disturbances in the atmosphere related to day length would have the ability to interact with the Lamb waves that were set off the day prior. This resonance could potentially strengthen the impact of any atmospheric phenomena related to day length.
Figuring out whether they do turned out to be a bit of a challenge. There are plenty of climate models to let researchers explore what’s going on in the modern atmosphere. But a lot of these have key features, like day length and solar output, hard coded into them. Others don’t let you do things like rearrange the Earth’s continents or change some atmospheric components.
The researchers did find a model that would allow them to change day length, solar intensity, and carbon dioxide concentrations to those present when Earth’s day length was 22 hours (which was likely to be in the pre-Cambrian). But it wasn’t able to reset the ozone concentrations, and ozone is also a greenhouse gas. So, they ran simulations without ozone, which are expected to be an under-estimate, and one where they elevated methane concentrations in order to mimic ozone’s greenhouse effect.


